Quantifying Angst by Danny and Allan G. '20
the most course 6 thing we've ever done
Three weeks ago in 6.009 (Fundamentals of Programming), we had to code a lab called Autocomplete. It was about implementing a data structure called a Trie (pronounced either “try” or “tree” depending on who you ask), which is “a type of search tree that stores an associative array (a mapping from keys to values).”
One of the functions that we had to implement takes in any text file and spits out a list of tuples of all the words in that file and their respective frequencies of occurrence.
So if the input to this function is a text file that contains: “hi hi hi hi hi bye bye”
then this will be the output: [(“hi”, 5), (“bye”, 2)]
After we submitted the lab, we thought about the power of this function and what we can do with it! What if we can somehow make our text messages into a text file and feed it into this function to see what words we use most frequently in our day to day lives?!
We immediately thought of doing this to the group chat we have with our friend Charlotte M. ‘20, because it is a truly angsty experience that has been in the works for almost a year — prime real estate for data analysis! When we suggested this idea to Charlotte, she actually started jumping up and down and did her omgomgomg-I’m-so-excited hand gesture. Then Allan did his omgomgomg-I’m-so-excited hand gesture. Then Charlotte’s friend, Katie O. ‘19, commented on our hand gestures, since she works in a lab that analyzes hand gestures. Danny was working on 18.03 and looked up confused by all the hand gestures and talk surrounding them. This school is full of wonderfully nerdy people if that wasn’t clear yet.
The first step was figuring out how to turn our facebook messenger chat into a text file. We looked this up and apparently you can download all of your facebook data (including all of your messenger chats) super easily!
After it downloaded, and we found the right file in the downloaded folder, all we had to do was convert it (since it downloaded as html from facebook). We just used an online converter for this.
Then, we put the text file into the correct directory on one of our laptops so that our lab file with the function would have access to it, used terminal to run the function, and got the data!
The output that we got was an extremely long list of ALL the unique words we ever used in our group chat. This is a small screenshot of what part of the data initially looked like.

We can’t include the code for the function we used to get this data, because that would be the solution to a pset that will probably be reused in the future. But we can include and explain the code that we used to make this above ugly and hard-to-read data into pretty and informative visual representations!
After thinking about what we could get from this data set, we decided it would be cool to pick certain phrases that we use often and graph the frequency of their multiple variations. Take the above image. At just a glance, you can see multiple variations of “aaahhhhhh.” So we wanted to make a graph showing how frequently each of those variations occur.
Using these websites as reference, we made the code below to make pie charts! Lines 553, 554, and 555 are how we filtered the data to get all the variations of “aahhhh.” To get all the other graphs, we would just change the if statements of those three lines of code to include the prefixes of the words we were graphing, and also to filter out words with particular letters that we did not want (like how the if statement on line 555 is filtering out the words with ‘t’s). We also thought about what information to display where, and decided that the legend would have both the word and it’s raw frequency (how many times it was actually used), and the pie chart would show the percentage that that particular variation of the word occured. The legend labels were done with lines 556 and 557. The pie chart percentages were done with lines 568 – 576.
Now get ready, because we’re about to serve you some *quantified* angst.
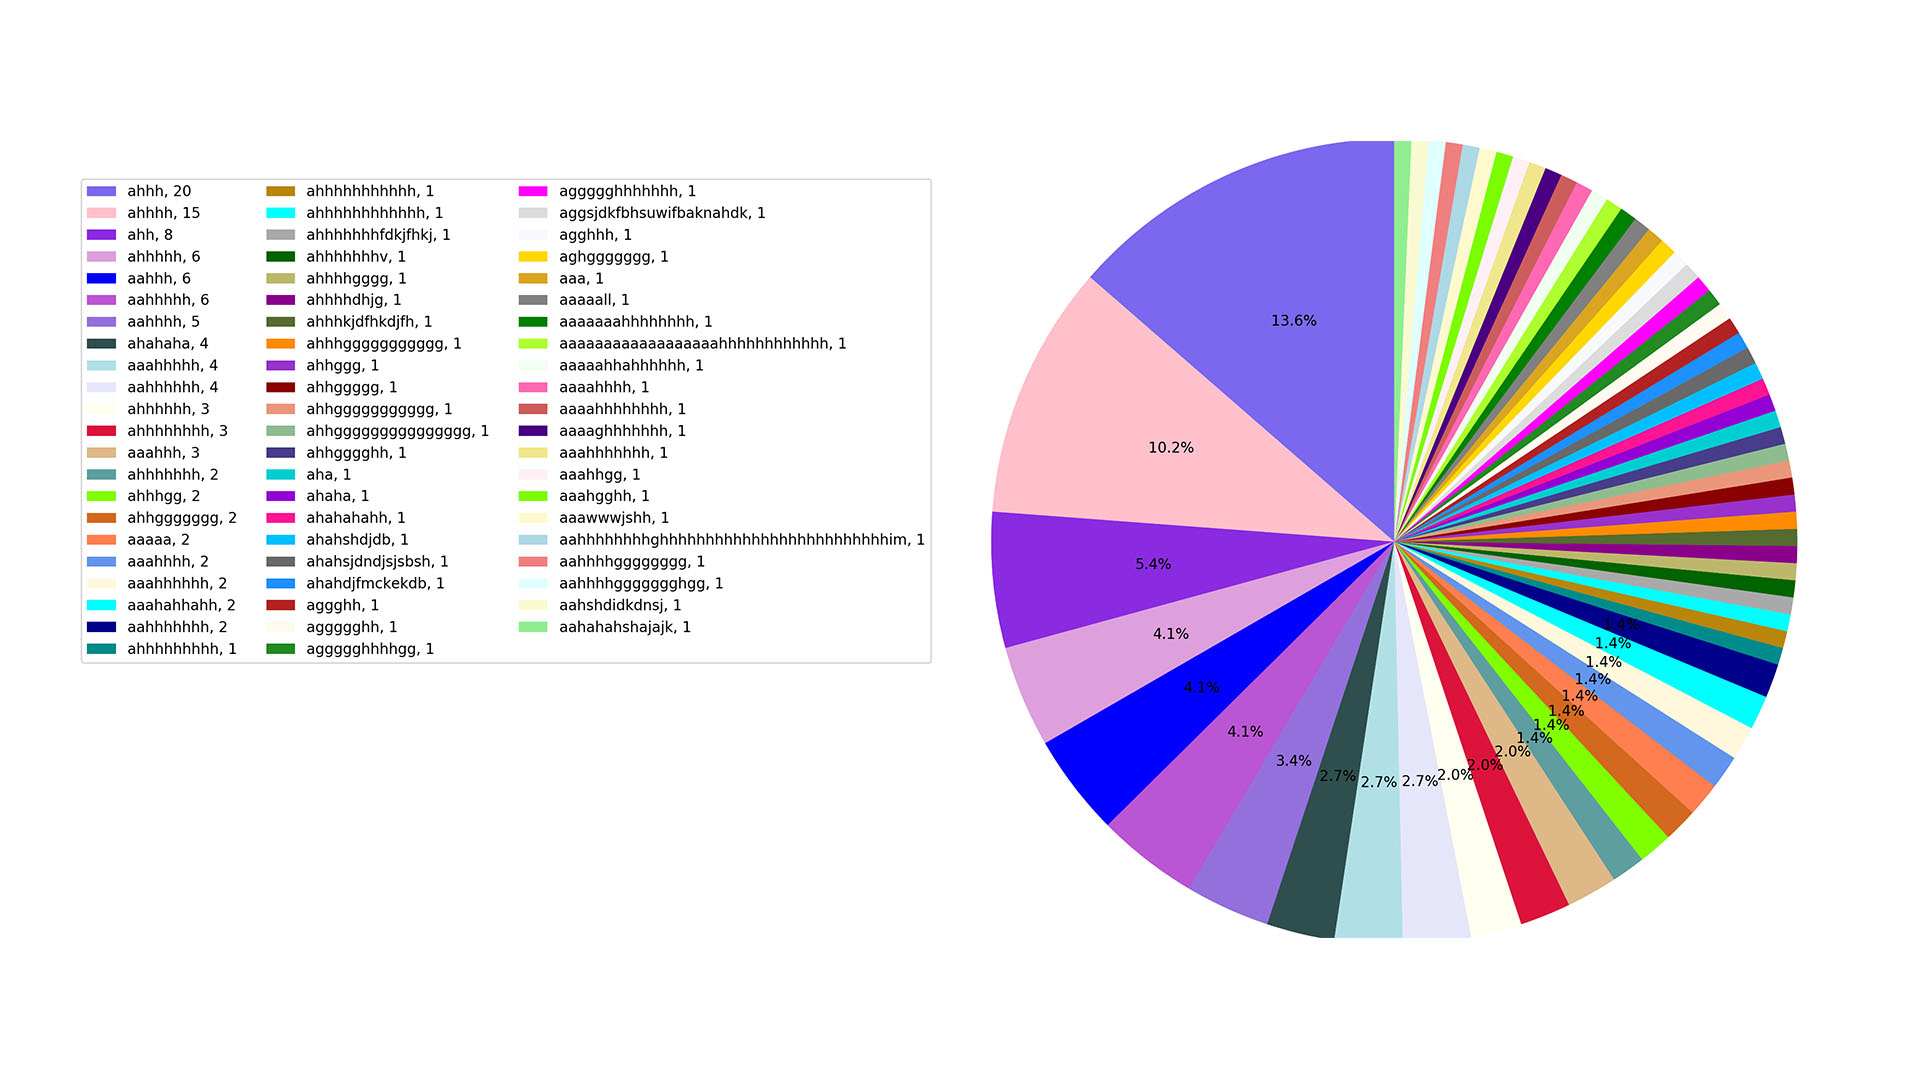
we scream a lot
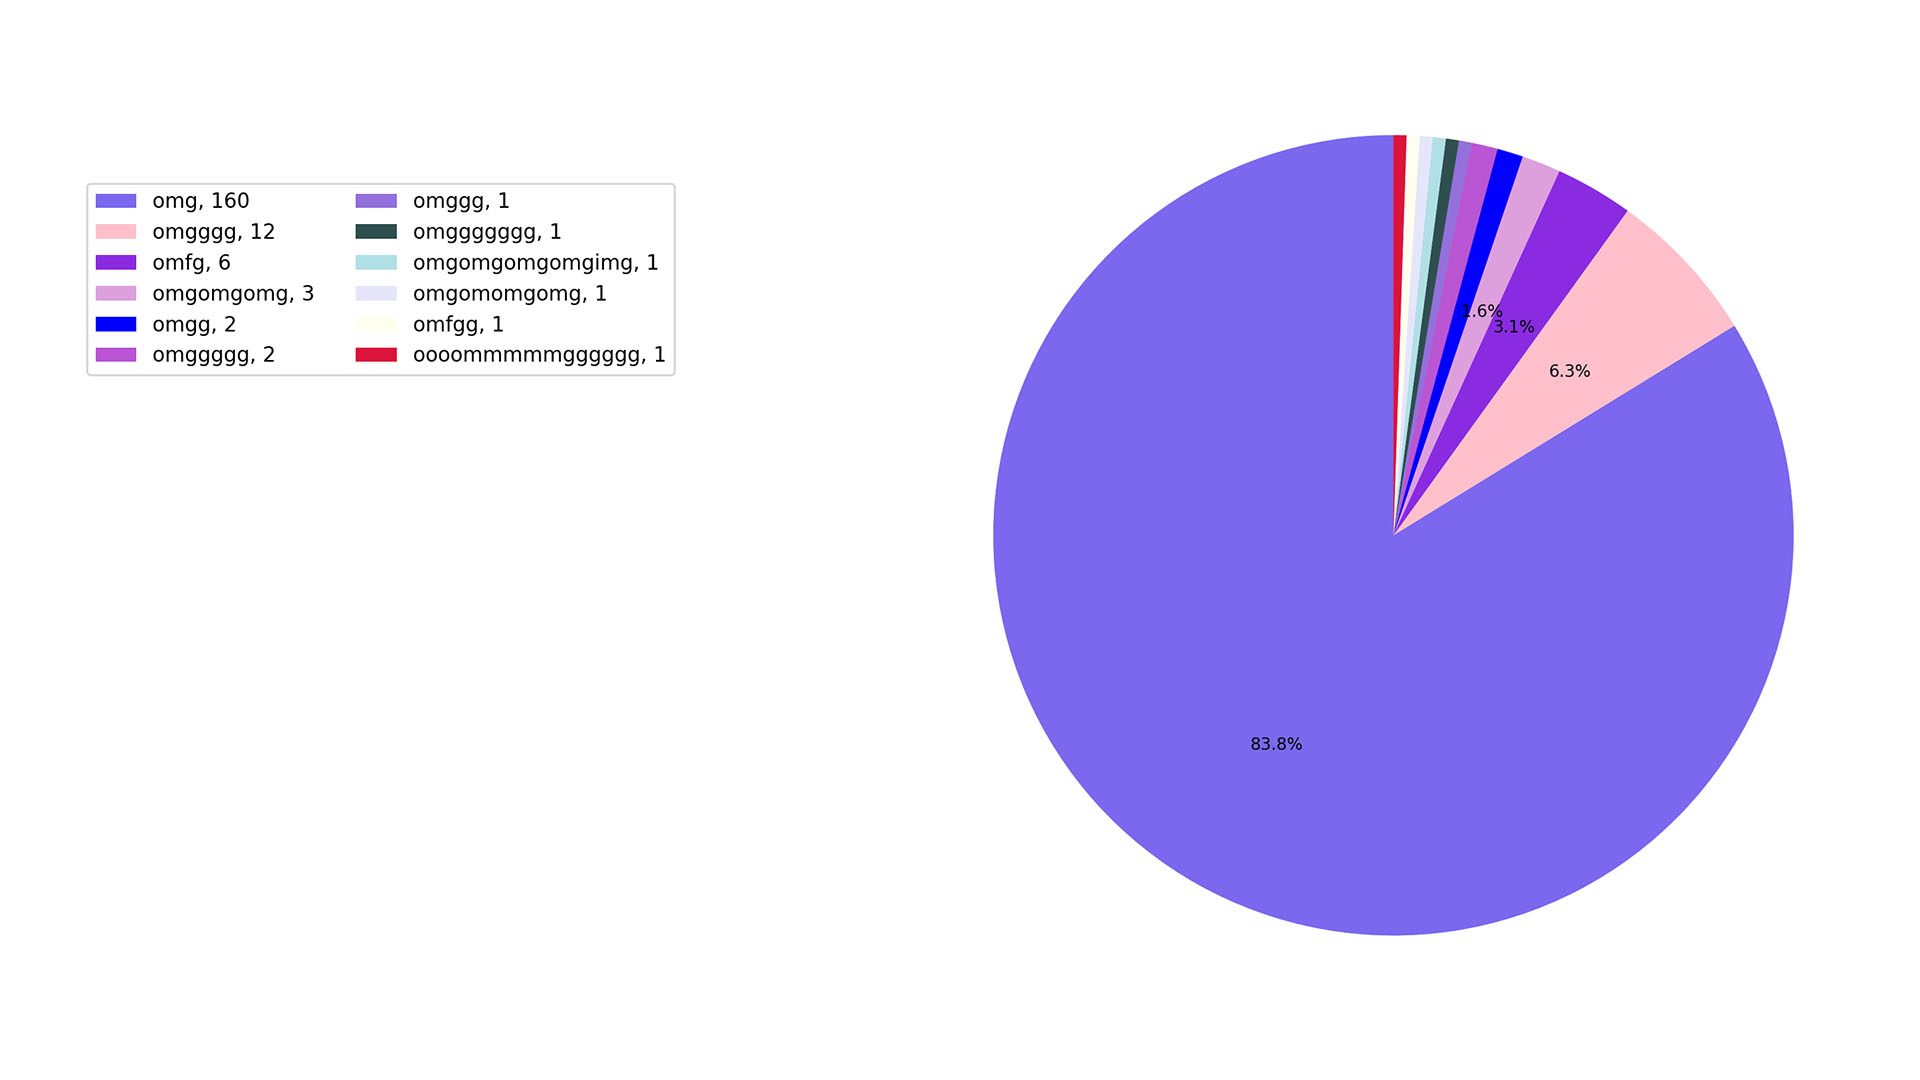
these omg’s are accompanied by hand gestures of course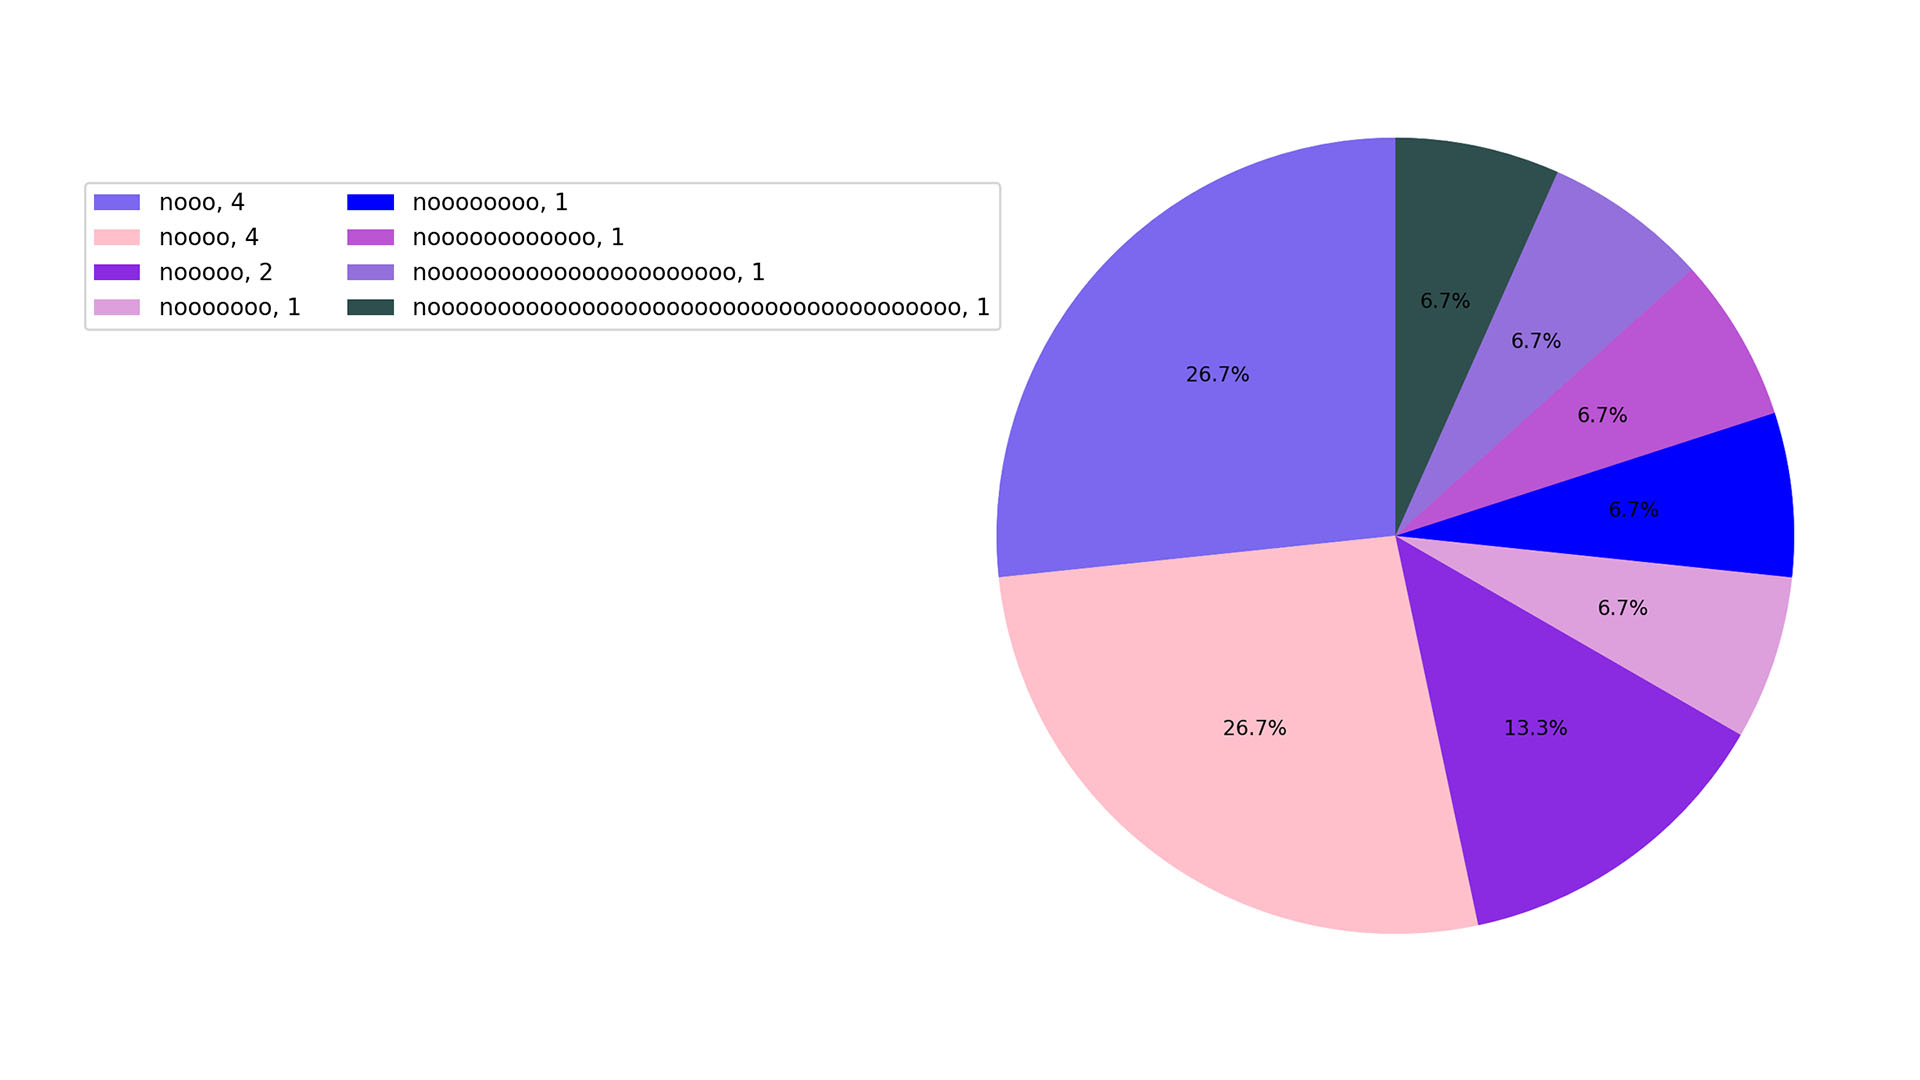
so many no’s
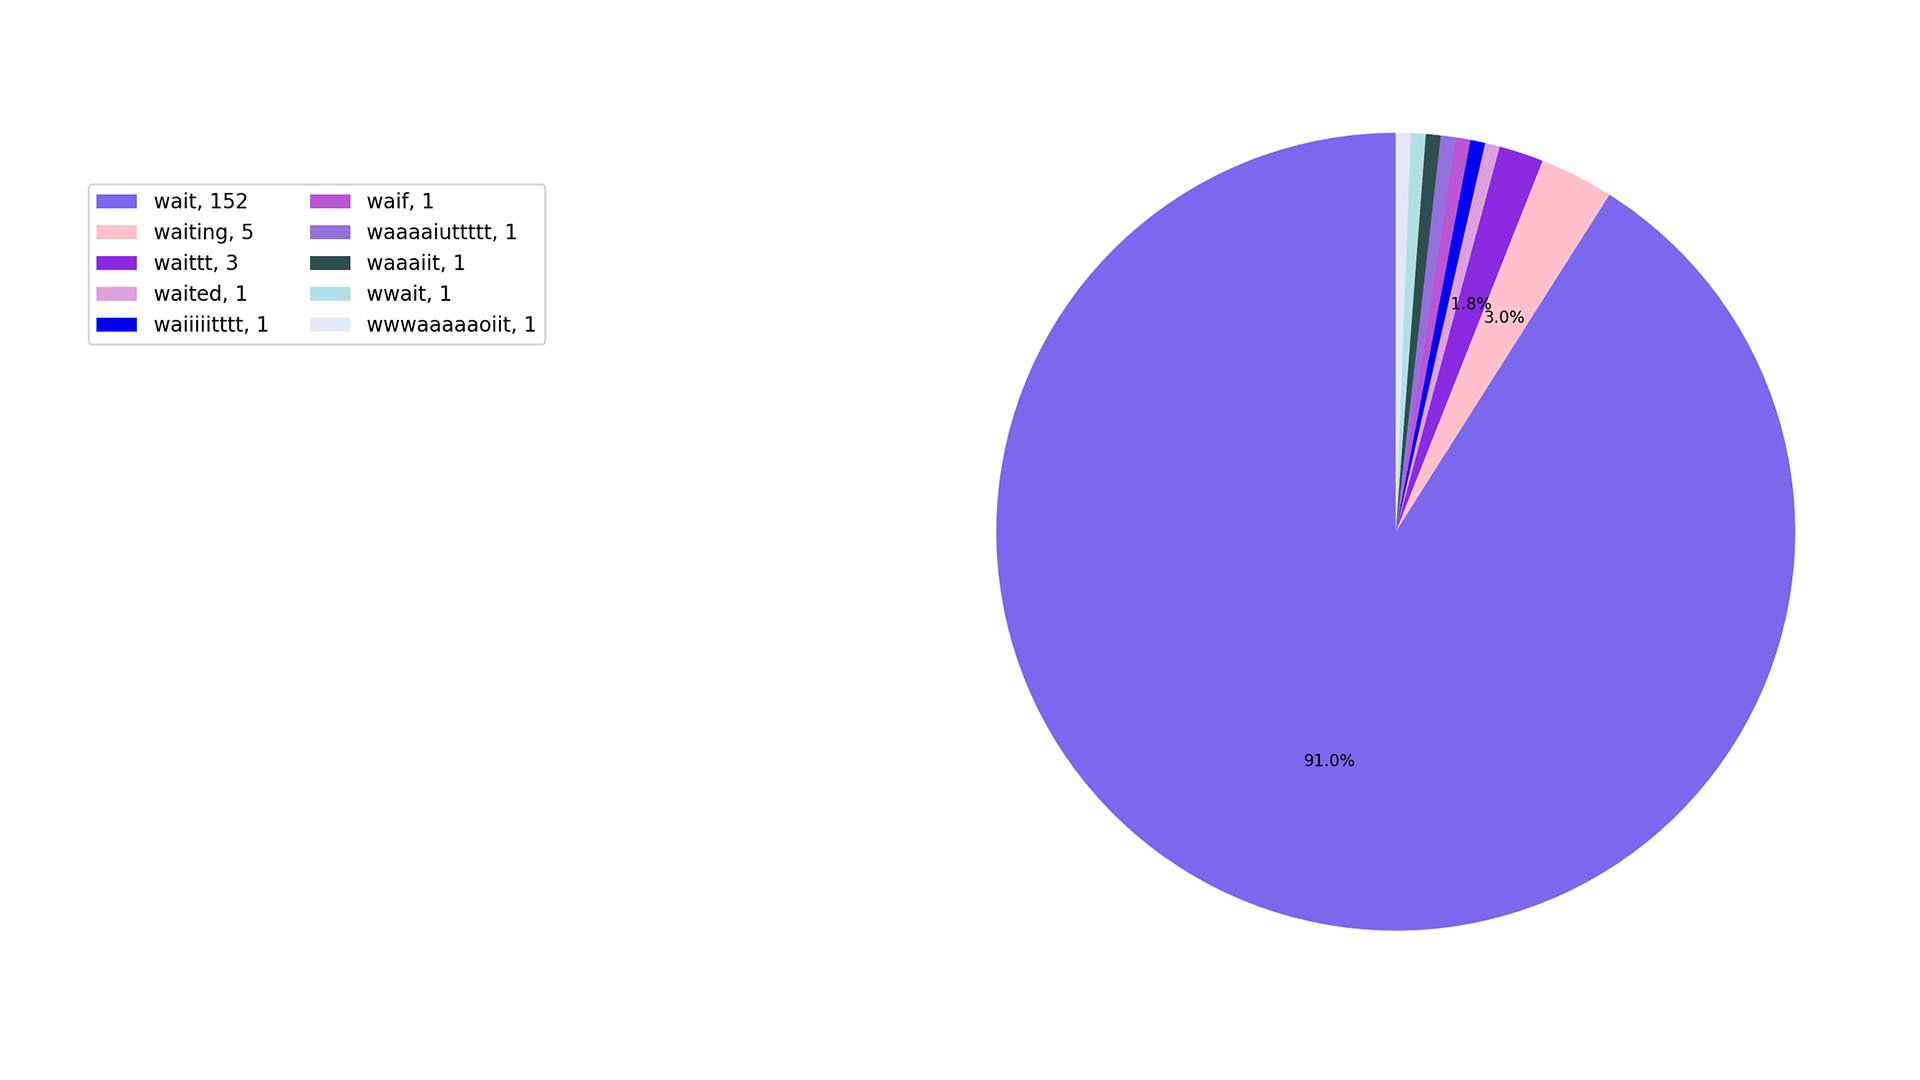
we are a patient bunch
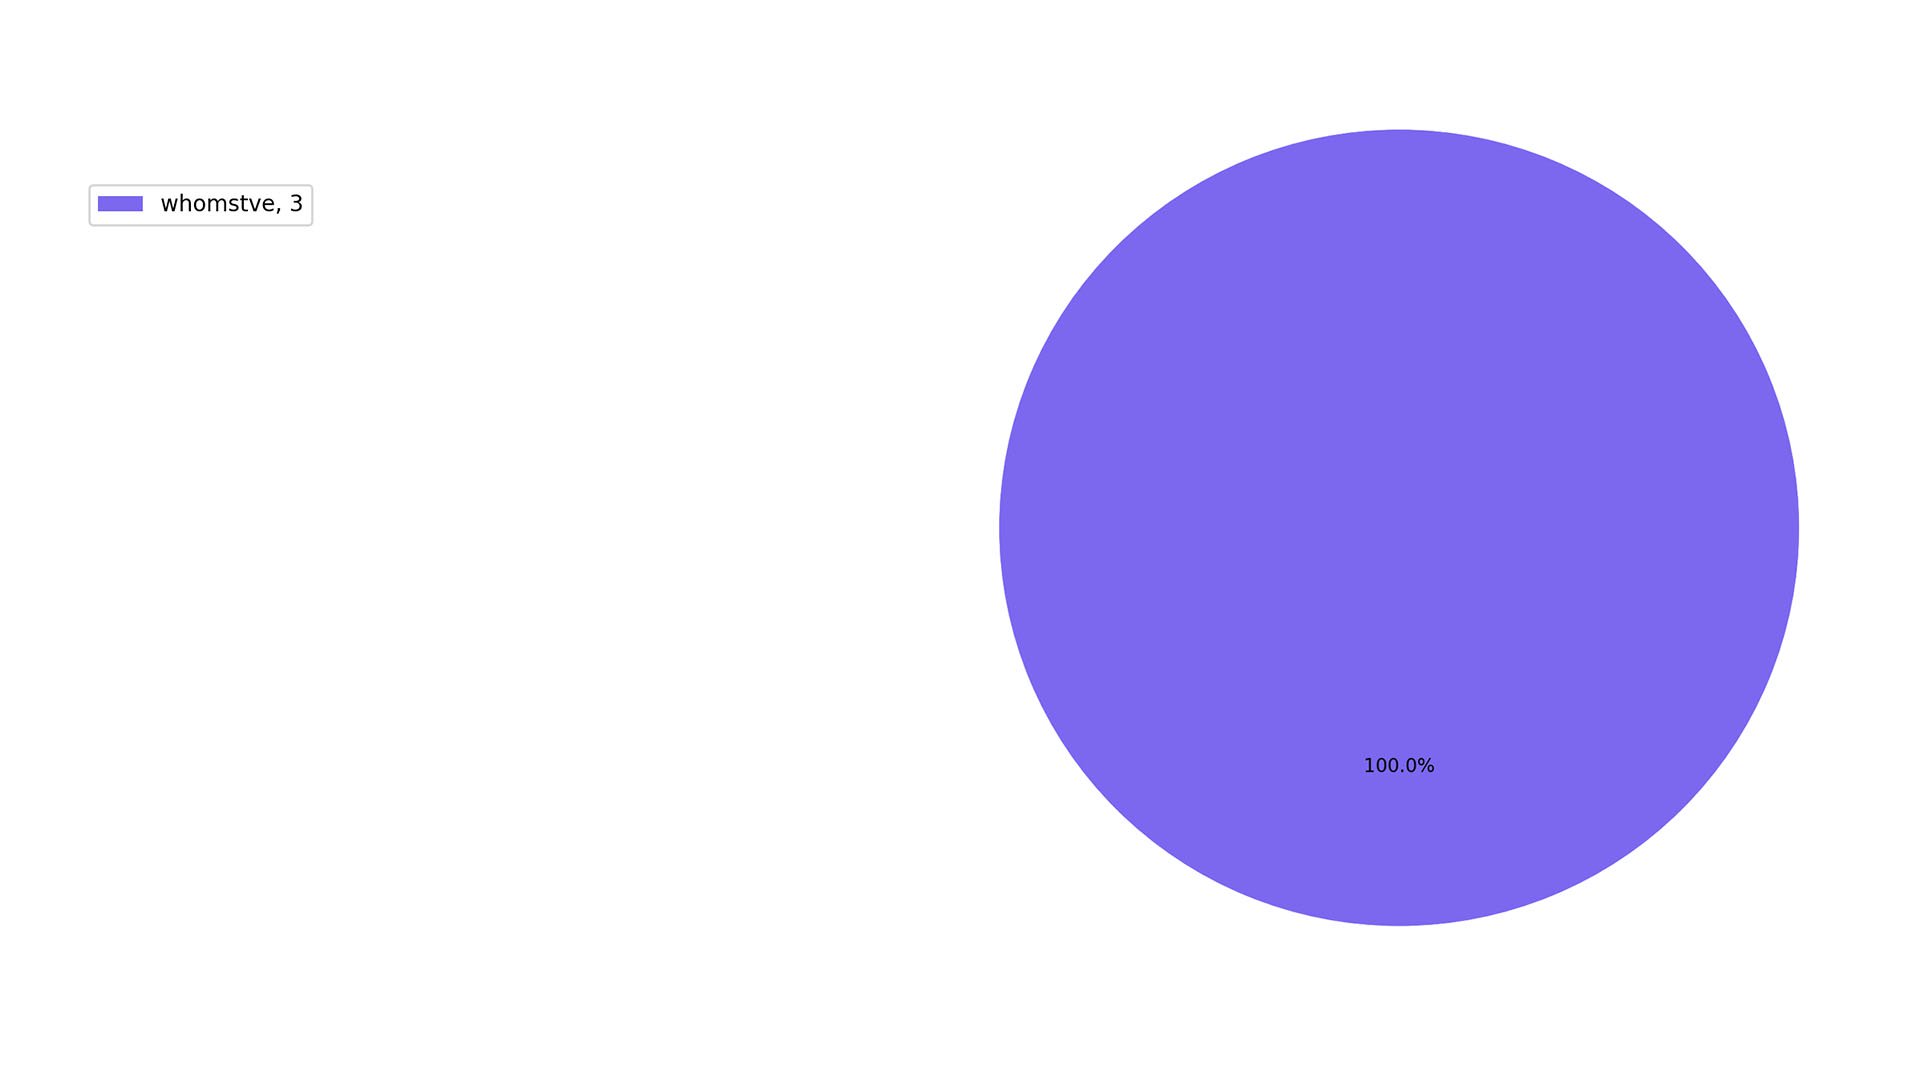
this graph literally says nothing about us, except that we need to get more creative and frequent in our whom- construction and usage
also it’s amusing to see a graph that is 100% whomstve
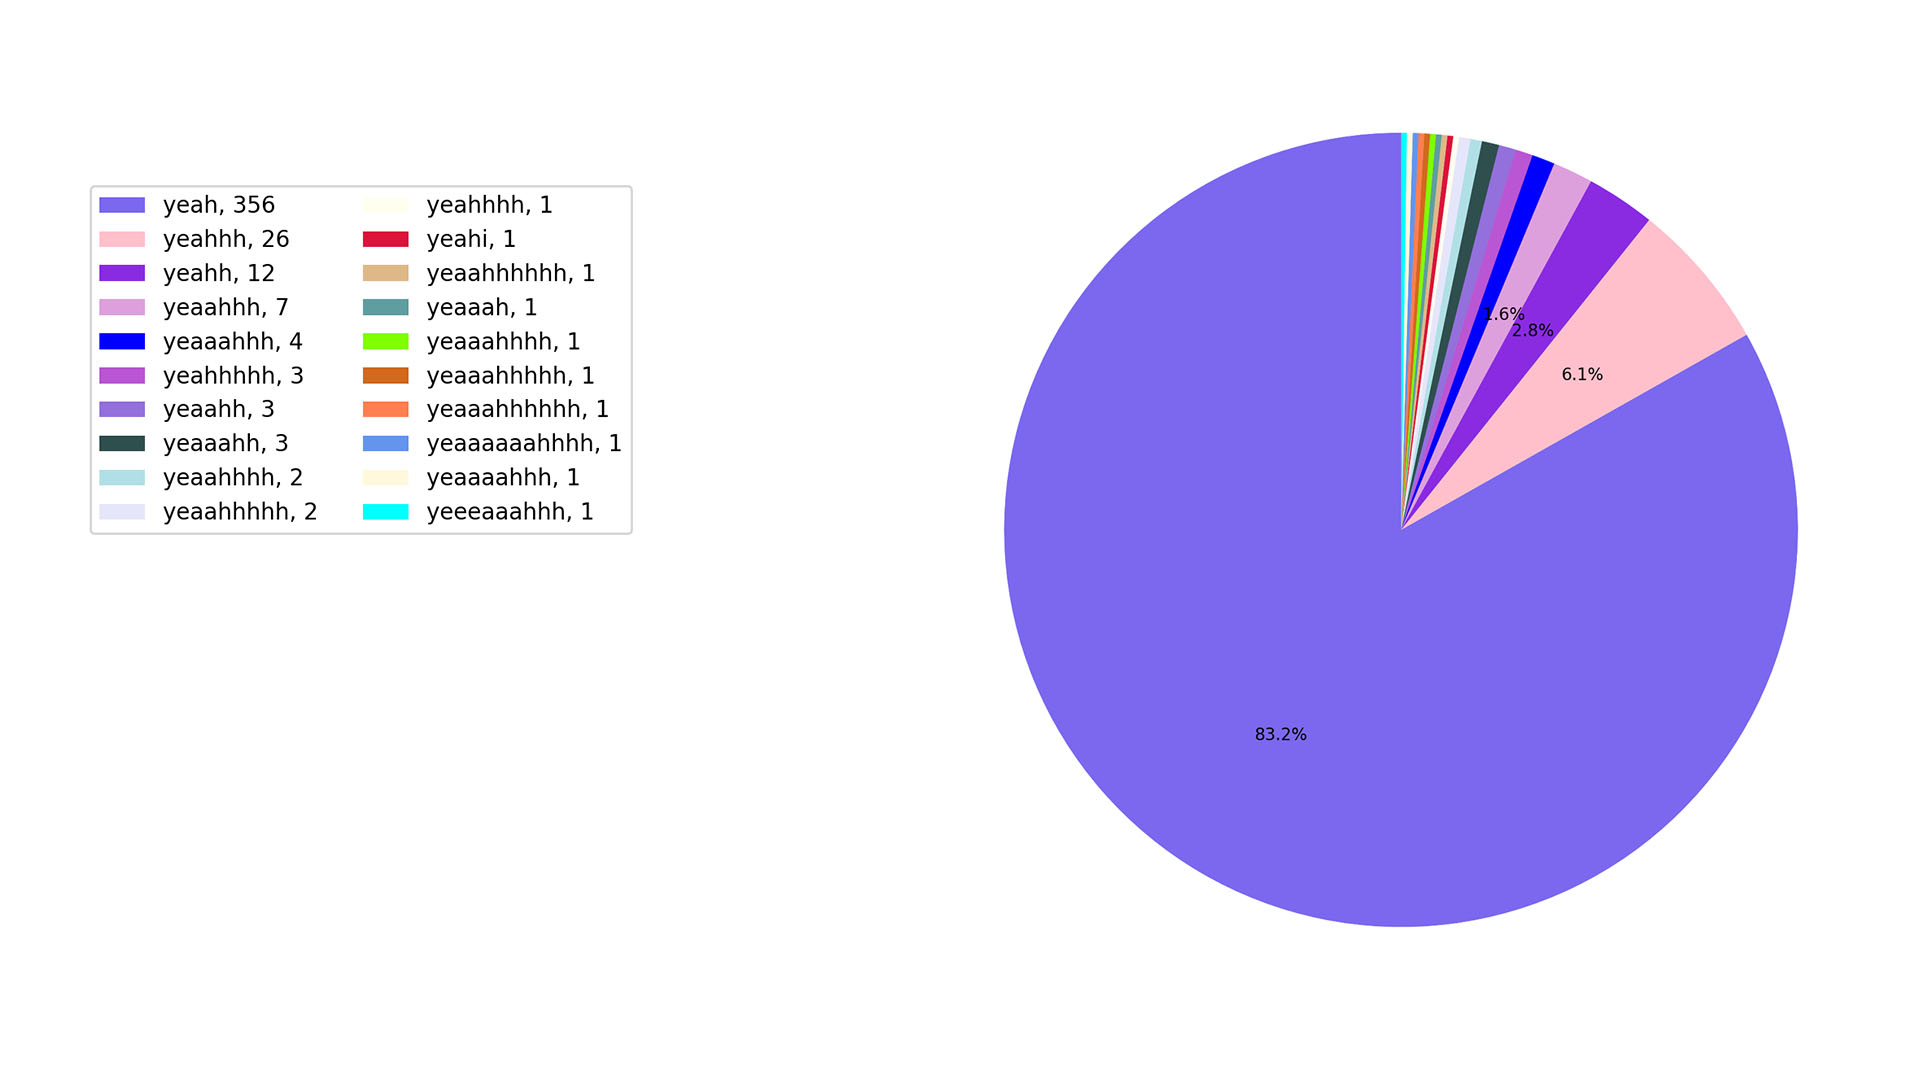
“yeah” can be used in a pretty chill way. we don’t use it that way
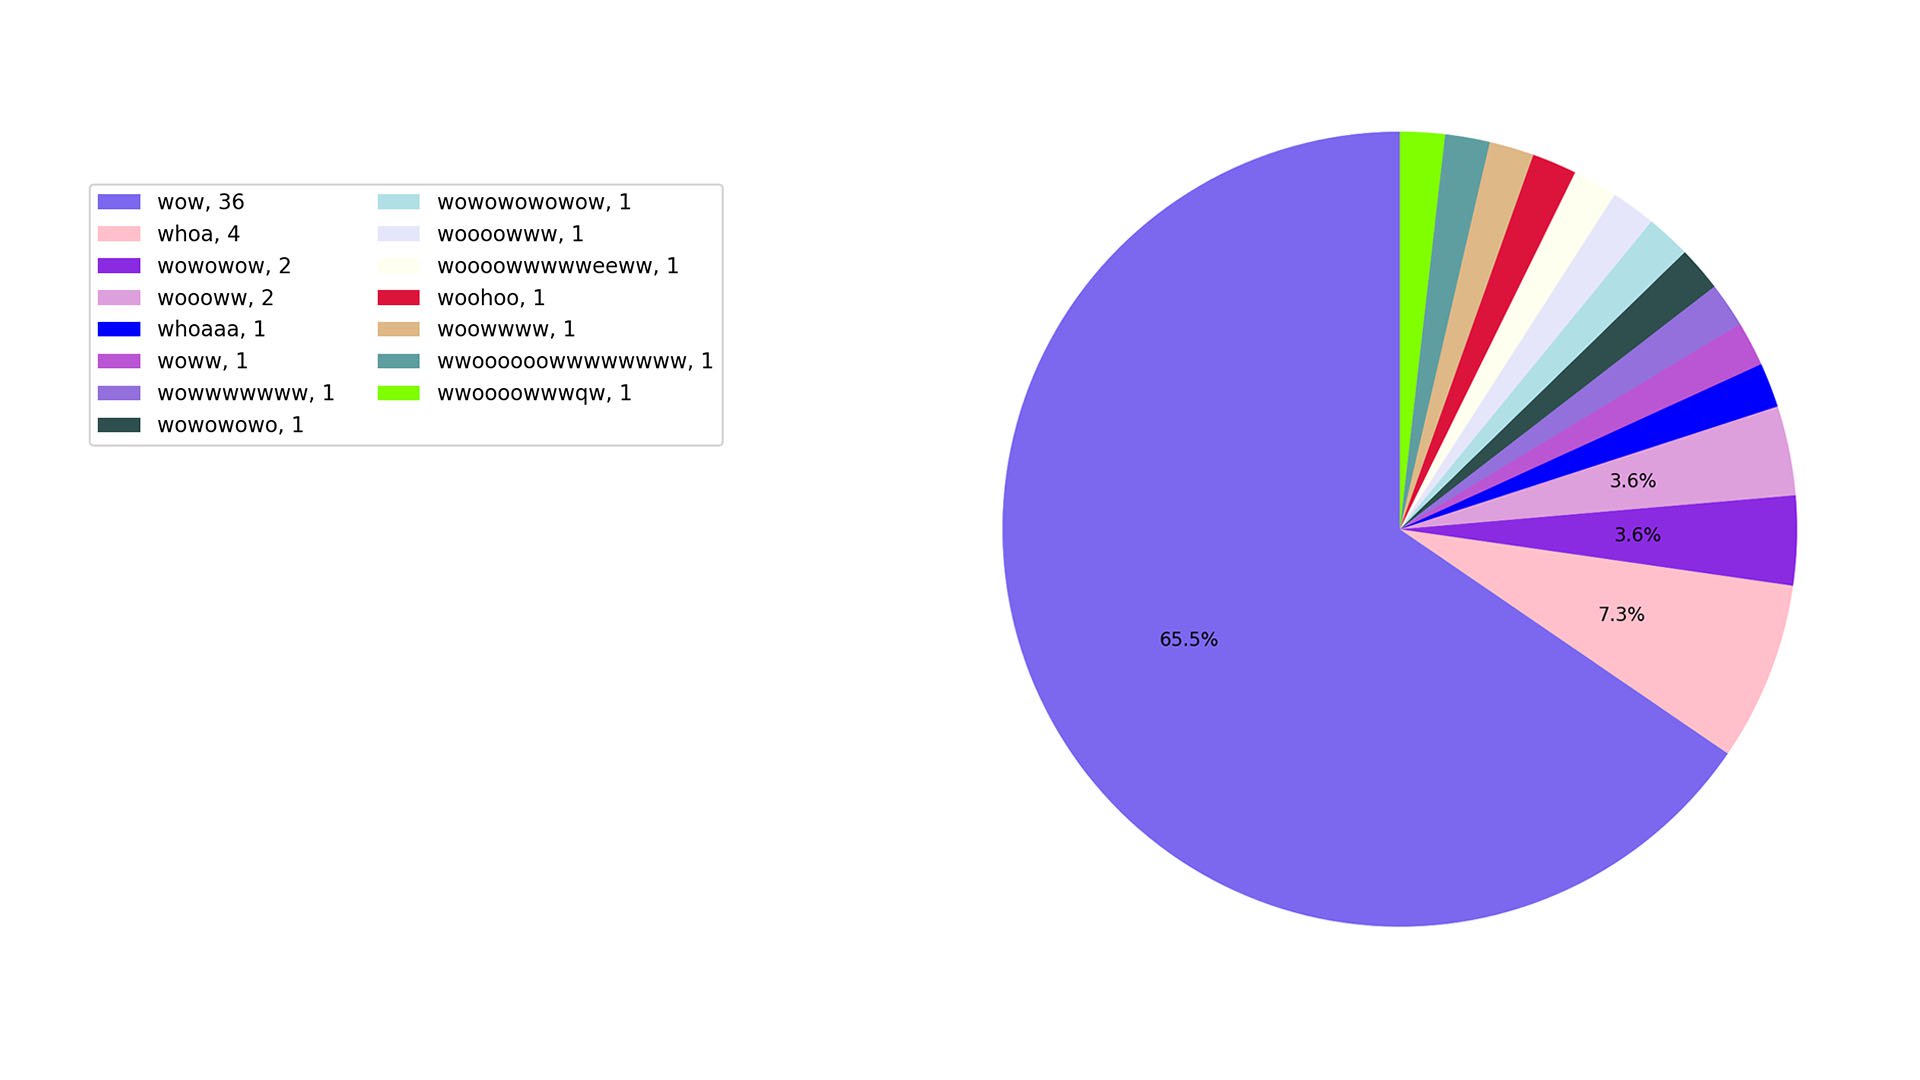
we are easily amazed
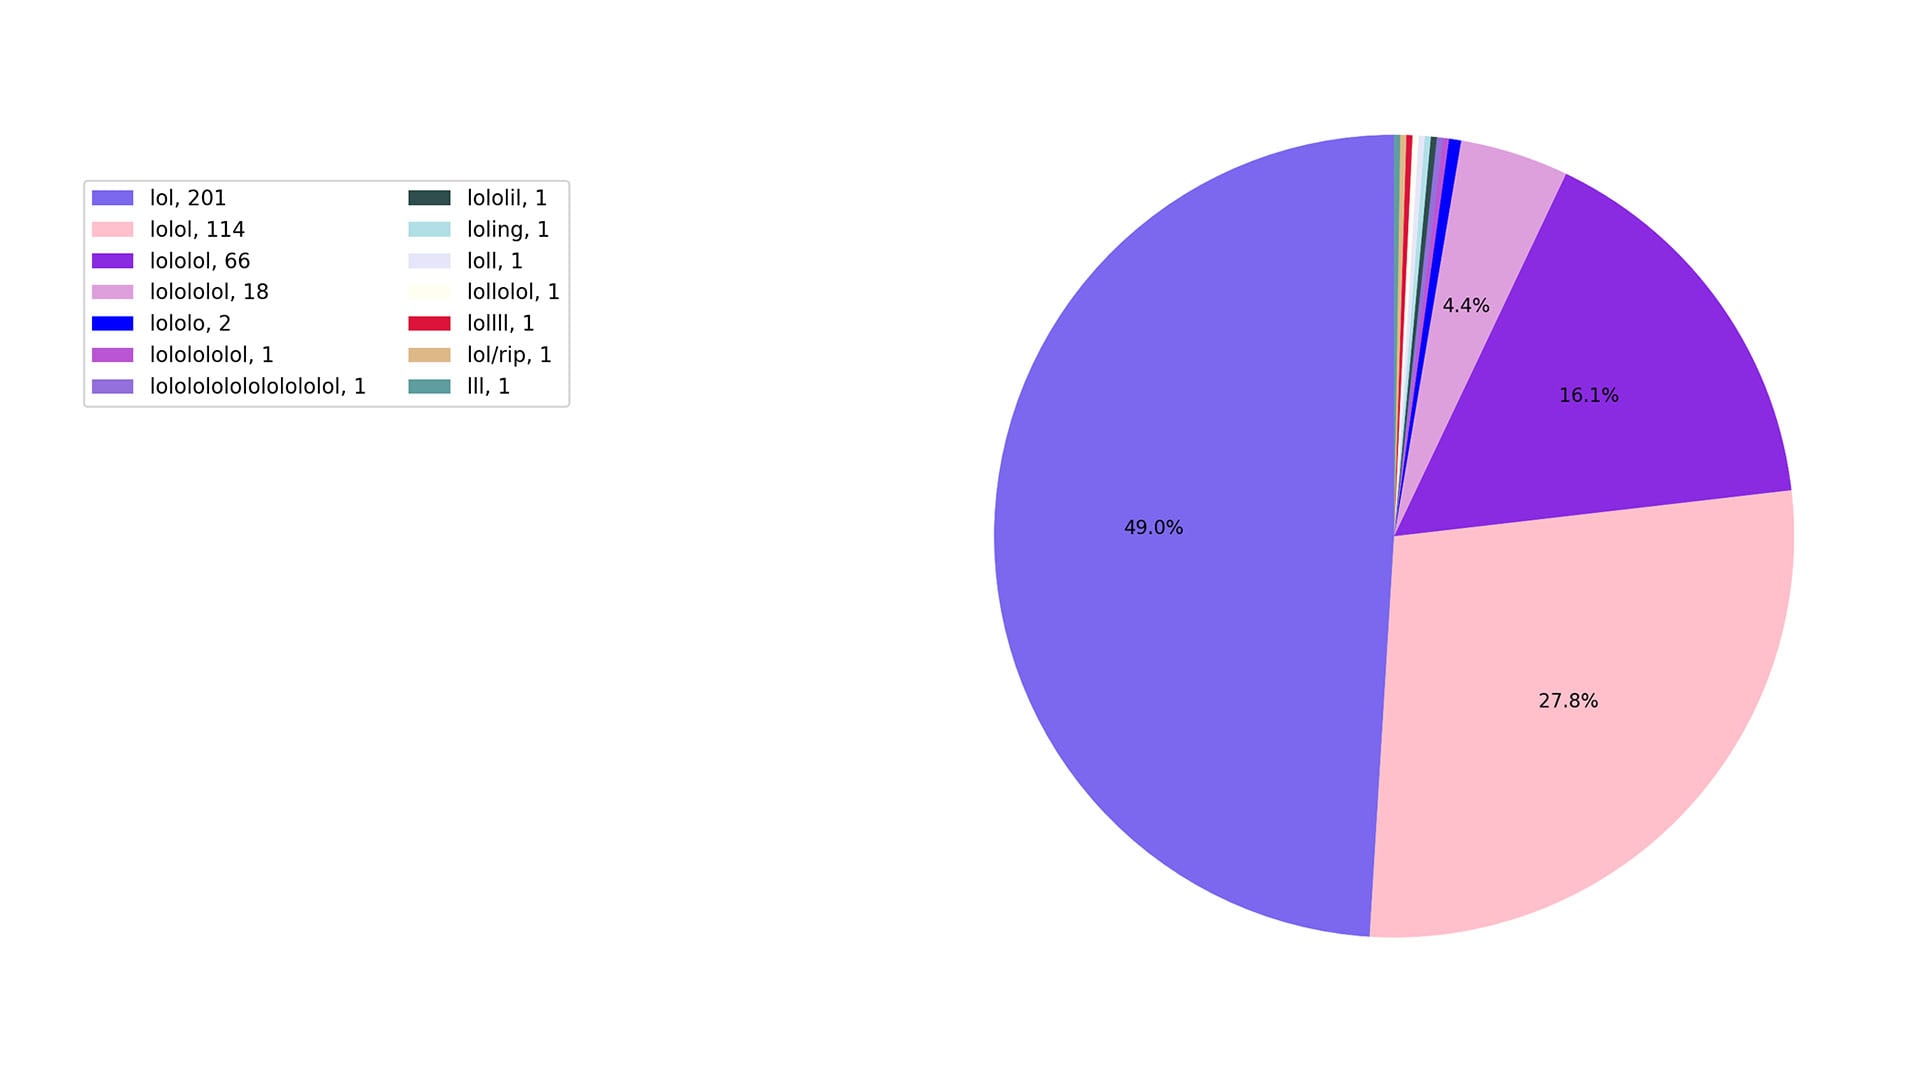
lol/rip is a gem … it’s also interesting that so many seemingly random variations of lol, like “lololol” and “lolol” were used so frequently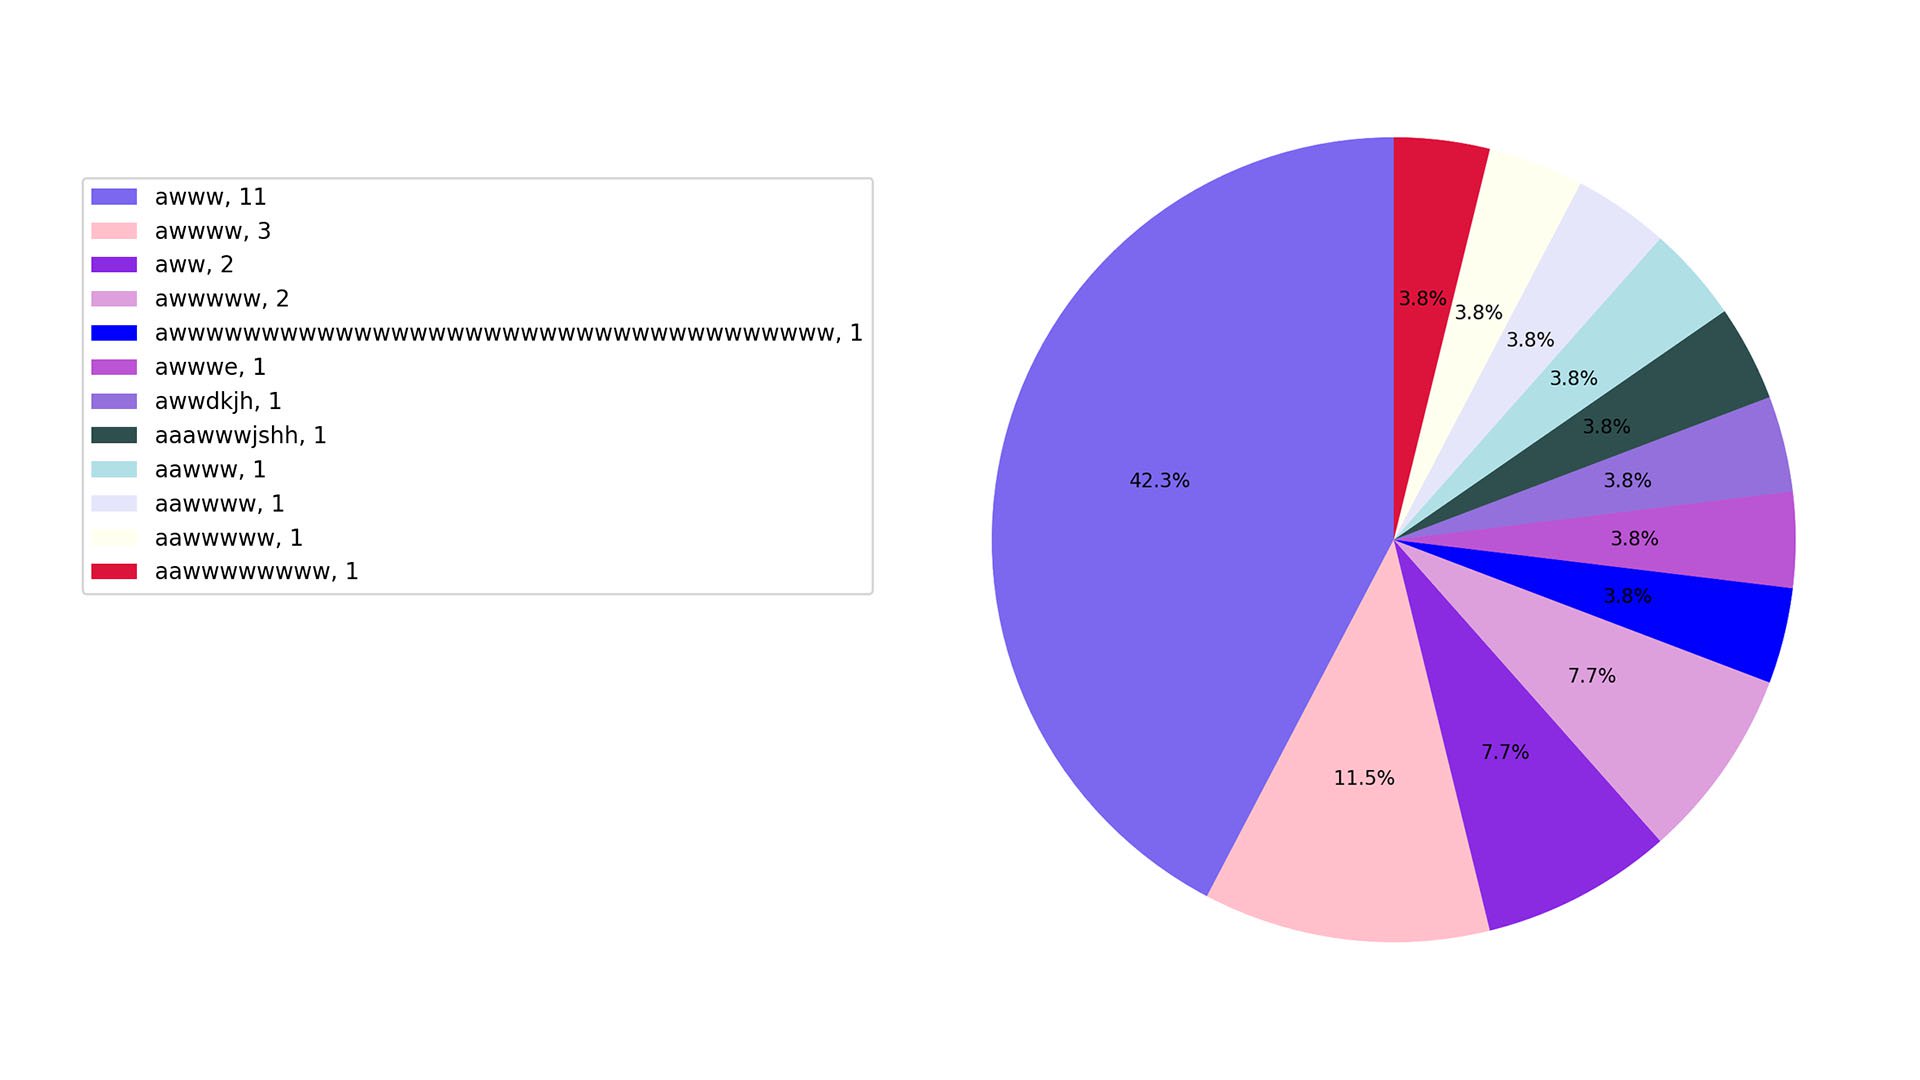
we discuss cute wholesome things and “awwww” accordingly
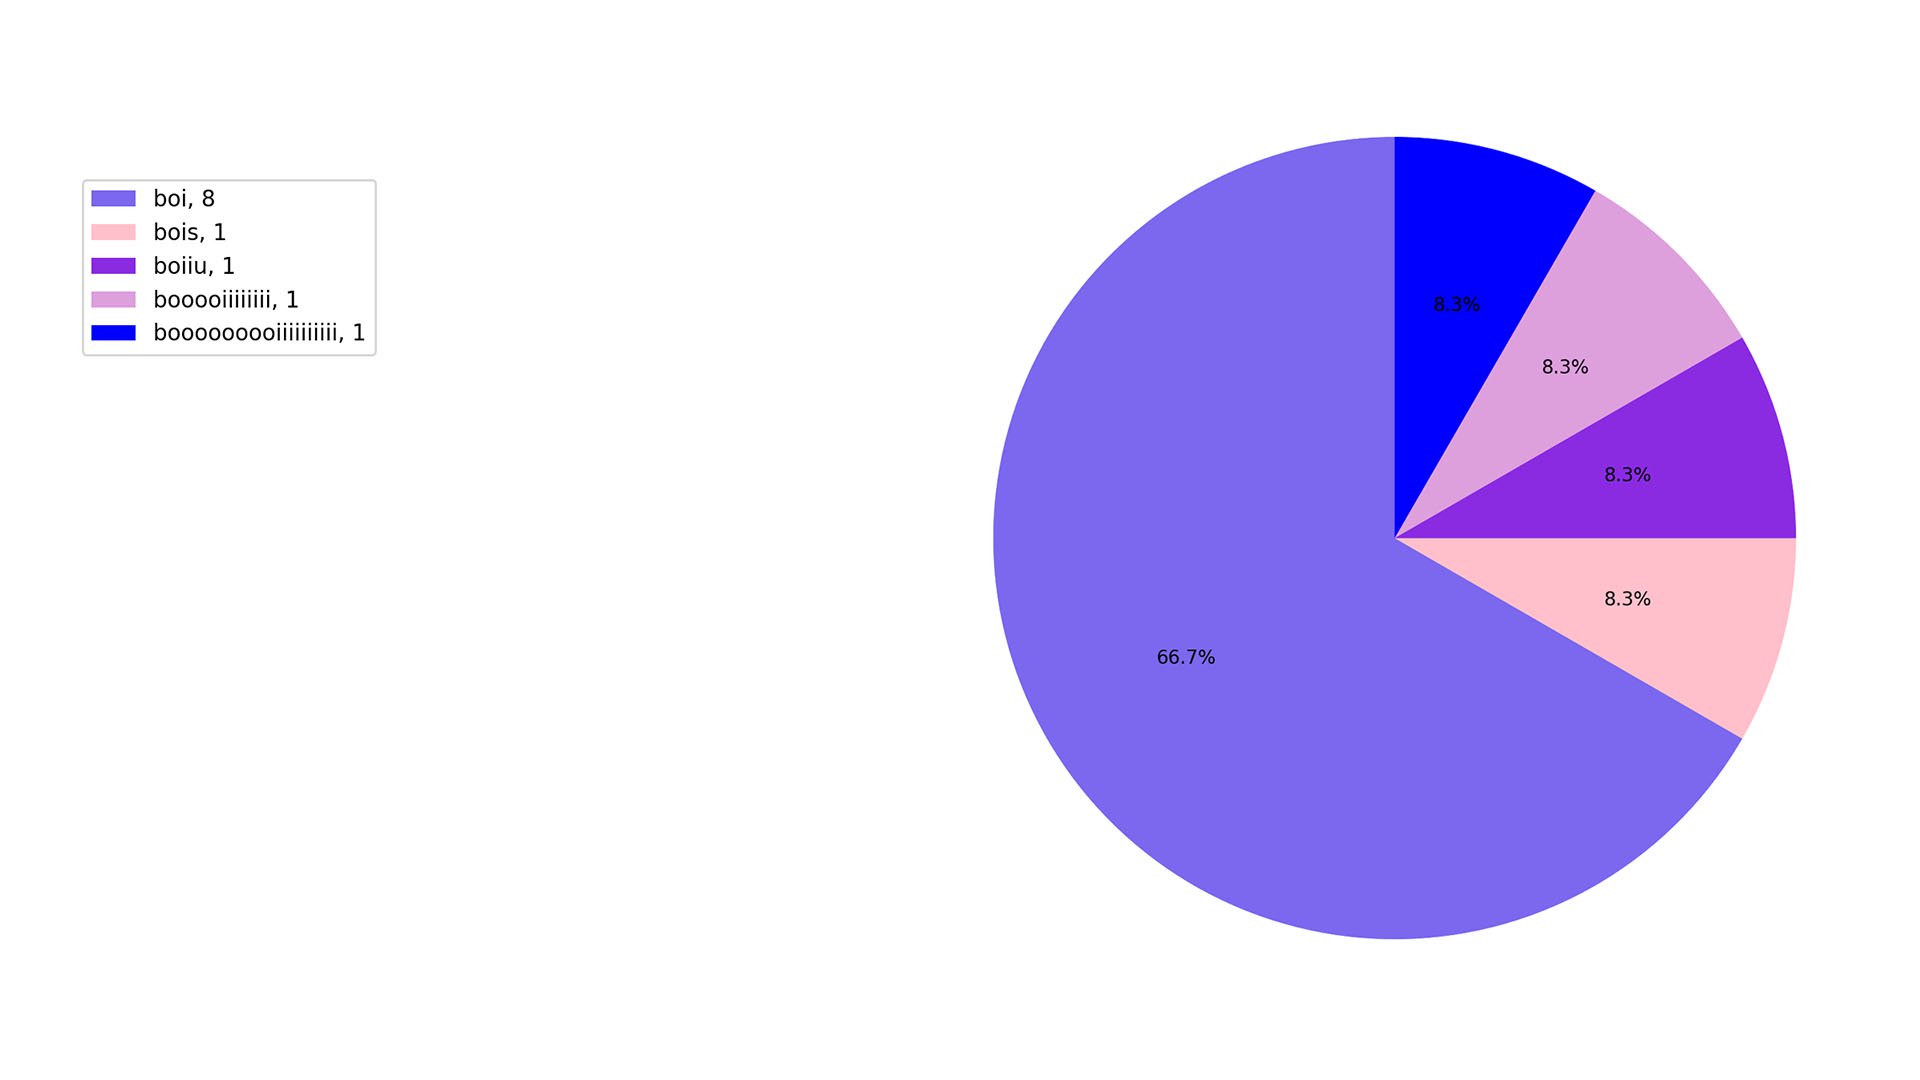
a very fun word to say/use tbh
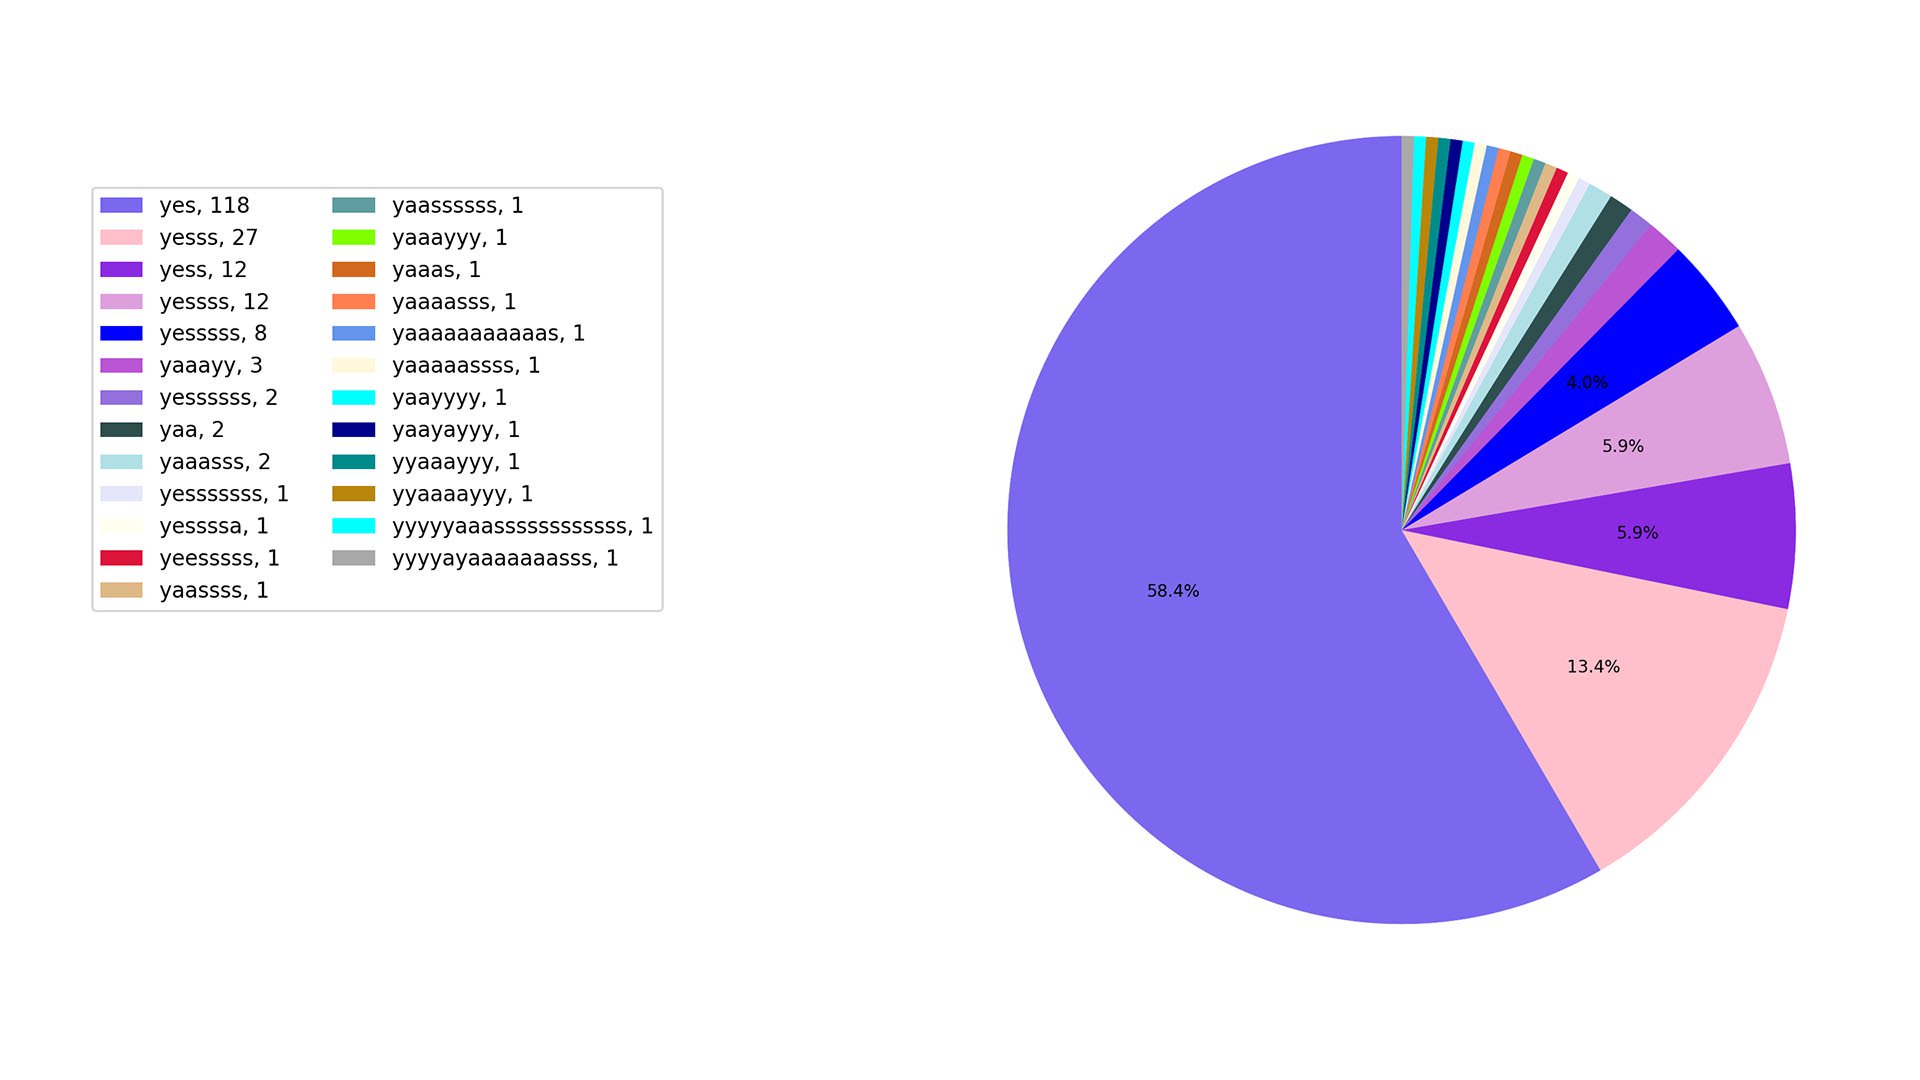
it makes us happy to see that we “yeesss” and “yaassss” more frequently than “nooo.” It’s around a 13:1 yes/yas to nooo ratio!
Hopefully this gave you some insight into our angsty group chat.