How to trick yourself into thinking that you’re writing a report by Anastassia B. '16
The most productive procrastination technique revealed at last!
Do you have trouble writing? Does it feel like a daunting, excruciatingly slow, and unpleasant task no matter how you approach it? Have no fear, for I am here to teach you how to trick yourself into thinking that you’re writing a report, and feel completely productive and proud of yourself when you do.
This post burgeoned from my experience with 20.109, or Laboratory Fundamentals in Biological Engineering, this semester, and you can read it along with all my classmates’ posts on our class blog here. This was the first technical communications class I took at MIT, and it has definitely opened up a brand new skillset for me to flounder in and ultimately improve. It has actually been an enjoyably challenging and fascinating course, solidifying my decision that double majoring in Biology and Biological Engineering was a wise recent move.
_____________________________________________________________________________________
The Optimal Procrastination Technique:
How to trick yourself into thinking that you’re writing a report
I would like to share with you an amazing strategy I’ve had the pleasure of discovering via 20.109 this semester.
You see, through tireless effort, countless attempts, and endless hours dedicated to grinding out reports for this course, I have finally discovered the most optimal procrastination technique. It is so effective, in fact, that at times it will irrefutably convince you that it is not procrastination, but work of the utmost and immediate importance. It may seem difficult to implement at first glance, but believe me, once you train yourself to stop the urge to write your results down and get the report over with, you will find this technique very easy to master and even quite enjoyable. In the end, you might figure that is it too overwhelming or unnecessary to actually write the report anyway, and your problem is solved!
Curious? There are two key steps to for this process to work.
1) Read all of the related literature. ALL of it. Read it in depth and pay attention to all the details. Follow the tangentially-related references and whatever you do, don’t stop reading until you’ve learned the complete history and current state of the field.
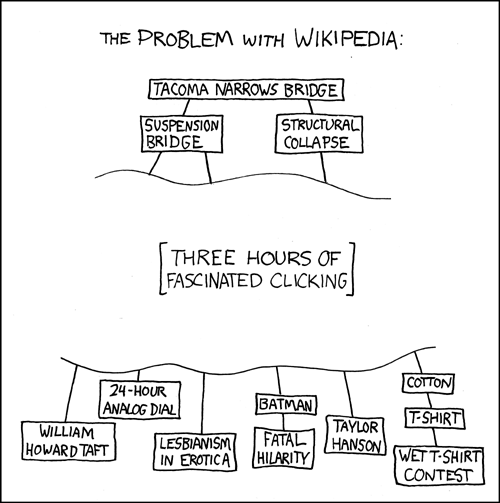
Figure 1: Schematic demonstrating the process from a more relatable starting point. However, this is biological engineering research, so I recommend you begin the voyage from PubMed, or at least google scholar. (Xkcd 2007).
I know, it sounds quite challenging at first. After all, you might just read a few papers and feel like you have a pretty good understanding of what is going on in general and how it fits into the experiments you did in class. DO NOT LET THIS FEELING FOOL YOU. I repeat, you have not learned enough yet. For example, you have to understand that it’s important to read beyond just all of the literature on “Ku80 related NHEJ-repair in CHO cells,” which is probably under 10 papers anyway. Have you at least learned everything about the Ku80 protein? Do you understand its crystal structure? What–you didn’t know the crystal structure was elucidated in 2001? Then how are you to possibly understand the molecular mechanism by which it resects double stranded DNA breaks? Aren’t you curious about the differential repair results of your specific cut topology? I mean it’s your precious, darling, unique break-site architecture for crying out loud! Once you feel like you sufficiently understand enzyme-DNA dynamics, you can move onto exploring all of DNA repair, or at least homologous repair which you can frequently mentally compare. Don’t forget to really explore all the sub-branches, mechanisms, and implications. It’s also really important that you don’t have a system for organizing all the useful portions of the literature that you read—downloading entire pdfs and dumping them into a folder or bookmarking the tab (try to keep switching it up for fun) should work fine. If there’s anything you don’t understand, a method or a term, immediately open a new tab (Figure 1) and learn about that until your computer overheats or the deadline for the report has passed.
Take home message: Don’t feel limited in your exploration! Remember, the point of your MIT education is to learn as much as possible.
2) Make all of your figures before you write anything. Then continuously remake them. Generate many types of visuals from the same data set. Keep changing them as you find little errors or large mistakes in reasoning. Try to make a large supplementary figure section to make sure your reader has a thoroughly comprehensive visual guide to your report. This is the fun part, so give yourself every excuse to keep working on them.
Ok, now that you have sharpened your critical reading skills, it’s time to move on to the artsy design skills you’ve dreamed of developing ever since you first used Microsoft paint in second grade. In fact, for nostalgia or for lack of more complex software, you should probably do all your figures in Microsoft paint. Sure you can plan them out in PowerPoint or Illustrator, but make sure to always drift back to Paint for any finishing touches. See how fun it is to manipulate each pixel? There is such a joy in eyeballing where things should be without those pesky guidelines always snapping and giving away the alignment solution! Make sure to spend a lot of time on font, text size, color palette, and especially about positioning the images into your report. This last step is particularly key because you have no idea how the text in your report is going to ultimately look like, so you might as well define it with images first. The text will then easily follow into the spaces you’ve confined. After all, if your report doesn’t look publication quality then how can it possibly contain useful information? So definitely make sure that the figures, and not the text, carry your research. This is also where many versions of the same image come in—if it doesn’t look “pretty” then have you tried changing the significance threshold so your error bars are smaller? You might as well take off the bottom error bars that annoyingly cross the axis anyway, since your audience is scientifically literate and understands that the range is symmetrical. Also, try to log transform your data and otherwise deviate from any “overly-simple” representation to really show that you are a researcher concerned with presenting compelling and clear visual results. Oh god wait—is that a formatting inconsistency? Remake your figures and watch as they grow more beautiful and more plentiful! Hopefully someday research can progress to where readers can follow the images and just read between the lines, you know? Then you don’t have to explain anything; just look at the graph people! After you’ve exhausted all possible data files and their representations, you should contemplate a side-career as a picture book author, which is perfectly suited for your visually-dominating, textually-minimalistic approach.
Congratulations! After these steps you should have a lot more files on your computer than when you started! You really have done so much work on this report; you temporarily know everything ever and just look at all those figures!! In fact, at this point you should feel pretty finished, since the remainder of the report is just filling in the words—trivial. In fact, it probably feels pointless to detail your results now anyway since you’ve realized it’s all mostly been done before, more carefully and much more impressively in the actual literature.
So you should probably just go take a nap, since it took a lot of effort and time to truly master the most productive procrastination approach to large writing projects. You only lose 1/3 of a grade per day for late work, so I encourage you to continue implementing this process after the initial due date. Good luck!
_____________________________________________________________________________________
All of the above advice was directly from experience, hah. It turns out that my new love for reading scientific literature was procrastination all along?!
Anyway, as a junior, I feel like I have experienced a complete learning shift at MIT this year.
The learning shift is roughly from learning how to problem-solve, to learning how to communicate the results of your problem-solving. In the past three months, I have written more technical writing (due to class work and UROP) than the sum of all months prior in my life.
This has involved a complete change in habits and mindset. Previously, it has not been difficult to “get by”, as in to pass classes, through adequate exam performance. Whether through regurgitation or manipulation of knowledge (even hastily acquired cursory knowledge from the night before turned morning of), a problem could always be attempted and partial credit could always be earned for effort, synthesis of ideas, and correct train of thoughts (trains of thought? trains of thoughts? being on the right track? all aboard the thought-train!), even if the final answer was incorrect or incomplete. Now, incomplete or incorrect results won’t cut it. The requirement now is not only functioning results, but the ability to describe the background, production, and implications of aforementioned results in a technical, concise, and effective manner. This year I’ve really grown in my academic realm, and now I’m feeling the time limit before graduation sink in. Now that I’m finally mastering MIT’s intensity and becoming deeply engrossed in my field, I realize I only have one year left and I should already be making plans for the future (what whyyyy I just got hereeeeee). The main skills I’ve been developing is being able to grind work out consistently instead of just before (…or after) deadlines, and not have a fear of and self-defeating approach to writing.
Therefore, I welcome the blarghonetowebosphere (Figure 2) reading my experiences even if I’m irrationally nervous about (or maybe just unnecessarily dreading/making a big deal of) writing them, and I will hopefully proceed to pump out more stream-of-consciousness posts about MIT life before it’s too late*.
If you have any questions about MIT, feel free to contact me at [email protected]!
*before I graduate, not before I lose consciousness
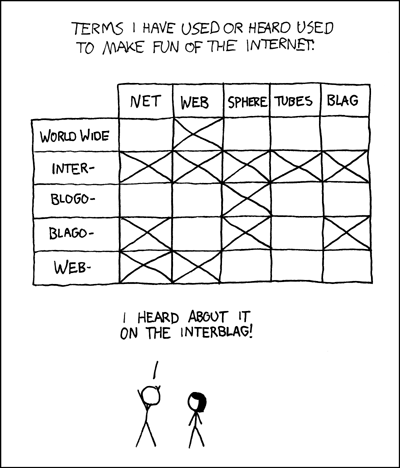
Figure 2: You can never have too many perfectly reference-able xkcd comics. You should read Joel’s post. (Xkcd 2006).