
Guitar Hero… on the oscilloscope! by Andi Q. '25
The secret fifth digital instrument revealed
“Wow, MIT has a class about digital instrument design now?”, my advisor exclaimed as he looked over my registration at the start of the semester, “That’s so cool! I would’ve loved that as an undergrad.”
“… oh wait, it’s about digital musical instrument design, not like oscilloscopes and stuff,” he said after reading a bit closer, “That’s, um, still cool I guess.”
Well, Joe, I’m pleased to announce that for my 6.2060 (Microcomputer Project Laboratory) final project, I’ve recreated Guitar Hero using an oscilloscope as the display.
A digital instrument played on a digital instrument!
Some background
Guitar Hero
Guitar Hero is a rhythm game where you strum notes on a guitar-shaped controller in time with some music to simulate playing a guitar. The notes are shown as circles moving down a virtual fretboard, which you play when they reach the bottom of the screen.
I chose Guitar Hero for this project for several reasons:
- It’s dynamic, fun, and one of my favourite rhythm games.
- It’s a cultural icon, so most people probably know what Guitar Hero is.
- The graphics are relatively simple and abstract.
- An MIT music professor created the game.
Due to time and hardware limitations, my recreation is a very simplified version of the game, but I think it still preserves the original’s spirit!
Oscilloscopes
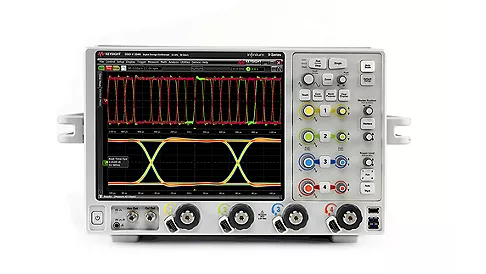
Fun fact: This beautiful oscilloscope from Keysight costs more than 4 years of MIT tuition. (We don’t have any of these at MIT, unfortunately)
Oscilloscopes are incredibly useful tools that measure and display voltage signals, which allows engineers to characterize and debug circuits. Normally, they plot these signals against time. This mode of operation, called Y-T mode, is great for visualizing the signal’s shape, and it is generally the only mode you’d need for most electronics projects.
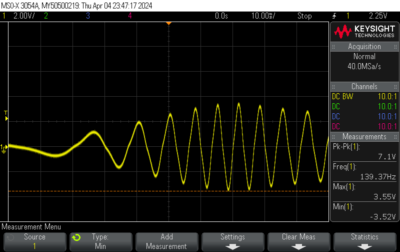
A voltage signal I measured from a motor after I spun it.
There’s also a second, lesser-known mode of operation called X-Y mode, where the oscilloscope plots two voltage signals against each other. X-Y mode allows you to visualize how “out of phase” (i.e., out of sync) two signals are by drawing an ellipse on the screen. Not terribly exciting, until you realize that X-Y mode is basically a very high-tech Etch A Sketch.
By carefully controlling how the two input signals (x and y) vary together:
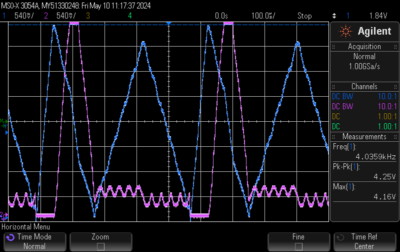
Blue is the y signal; pink is the x signal
You can draw line art of pretty much anything you want!
X-Y mode render of the previous two waveforms
Oscilloscopes are also insanely fast, so you can even animate things by slowly changing the input signals over time. This was one of the key ideas behind my project – using my little microcontroller to generate these signals in real time and feed them into the oscilloscope.
The idea of using an oscilloscope to render a video game is not new. Many early video games used this display mode, and some oscilloscopes even have Tetris as a built-in easter egg.
Putting it together
With this background in mind, let’s see how everything fits together. There are no physically moving parts in this project, thankfully (I’ve learned my lesson from my 6.2050 project last semester), but I still needed to:
- Render the game on the oscilloscope.
- Communicate wirelessly with a controller.
- Load and play music from an SD card.
- Load “charts” (game files storing the song’s rhythms and notes) from an SD card.
The special part of 6.2060 is that we get to build the circuits and code that power these components! It was kind of painful, but still fun in a uniquely MIT way.
Graphics rendering
For this project, we got to work with the PSoC 5 (short for programmable system on a chip) – an incredibly versatile little microcontroller made by Cypress Semiconductor. It’s a mixed-signal chip, meaning it allows you to work with analog and digital signals on the same microcontroller, which was pretty amazing.
The PSoC 5 has many, many convenient little devices built into it, like four digital-to-analog converters (DACs). Using two of these DACs, all I needed to render something on the oscilloscope was a list of x and y coordinates in my code.
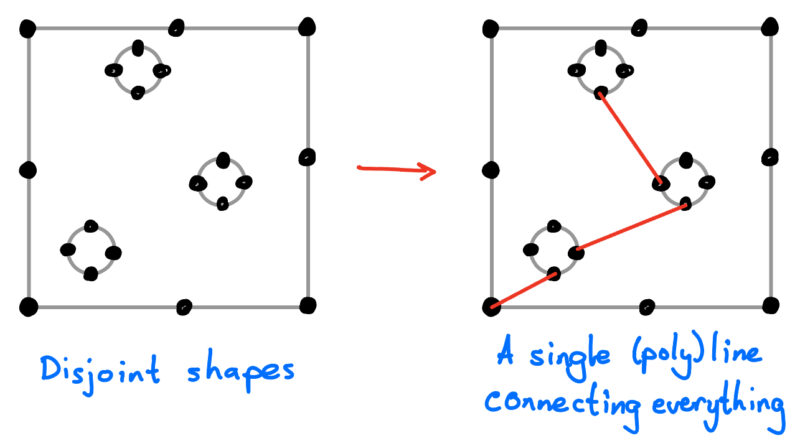
To generate this list of coordinates, I first represented each game object (mostly notes) as a “sprite” – something with a position coordinate and a pre-defined list of “shape” coordinates. I’d have ~15 visible sprites on the screen at any given point during the game, which I’d then “flatten” into a single list of coordinates by connecting them with lines:
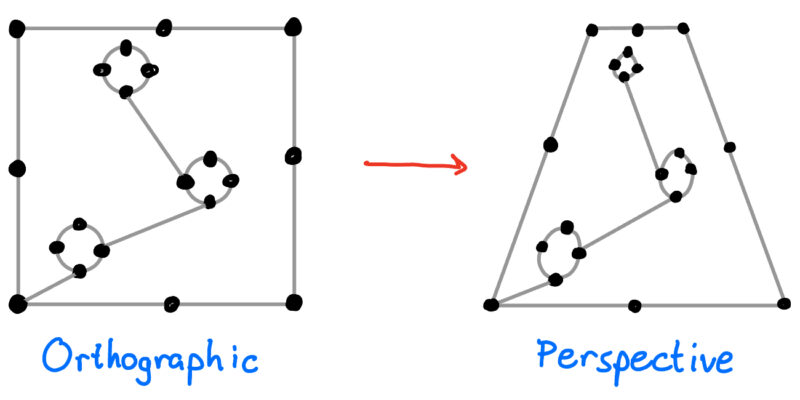
I also wanted to be fancy and display the game at a slight tilt, just like the original Guitar Hero. To achieve this, I had to put each point through a “perspective transform” (i.e., multiply it by a matrix):
I could then repeatedly loop over this list of coordinates and output the appropriate voltage levels to the oscilloscope.
Game controller
All the prior labs in 6.2060 made me hate wires, so I used Bluetooth to connect the controller (also made using a PSoC 5) with the console. This was also plug-and-play (just like the DACs), so I laser-cut a custom shape for the controller to make it a bit more impressive:
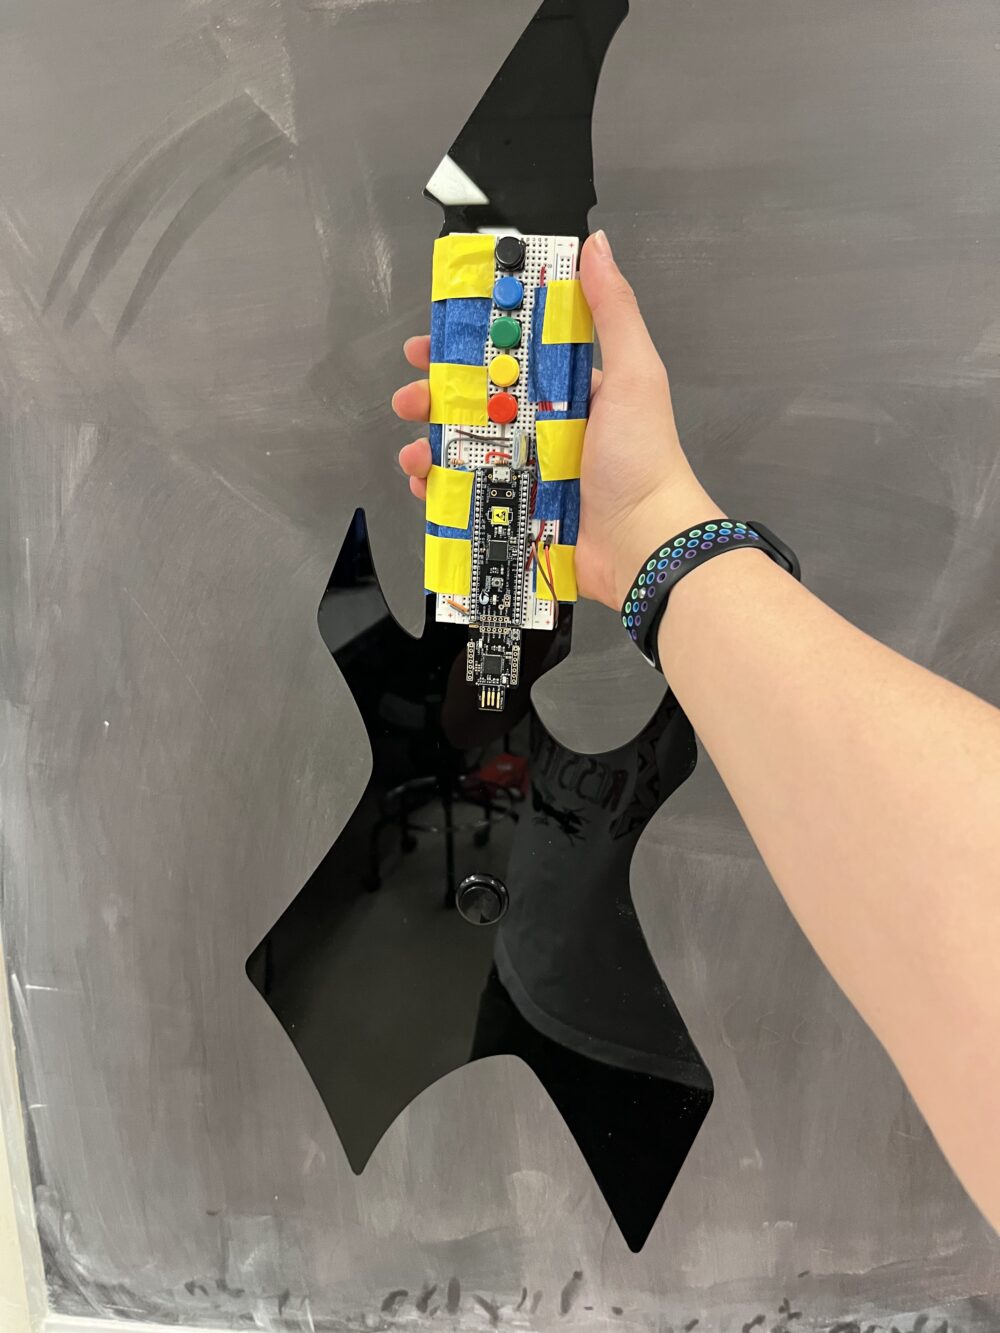
However, I accidentally designed the controller to be left-handed. I’ve never played a real guitar before, so I placed the buttons in a way that was most comfortable for me to hold. Only during playtesting did my friends point out that most people hold guitars in the opposite direction. We all agreed it was pretty funny though, so I kept this left-handed layout.
Music playback
Music playback turned out to be much harder than I had originally anticipated. When I first pitched this project to Professor Leeb, I assumed I could just store MP3 files in the PSoC’s internal memory and play them directly… somehow. However, he pointed out two big problems with this approach:
- MP3 files are compressed and require complex algorithms to decode.
- Even if I had these decoding algorithms, the PSoC’s internal memory was far too small to hold more than a few seconds of audio.
He suggested I use WAV files (a raw audio format) and an SD card instead, which would fix these two problems and allow me to load new songs on the fly. This was indeed the correct way to play back songs, but I still had some more work to do before I could get any output from my speakers.
The PSoC doesn’t have enough power to drive a speaker, so I needed to create an audio amplifier to supply this additional power. The circuit schematic for the audio amplifier looked kind of scary:

But it turned out to be a very cute little circuit that all fit on one tiny breadboard!
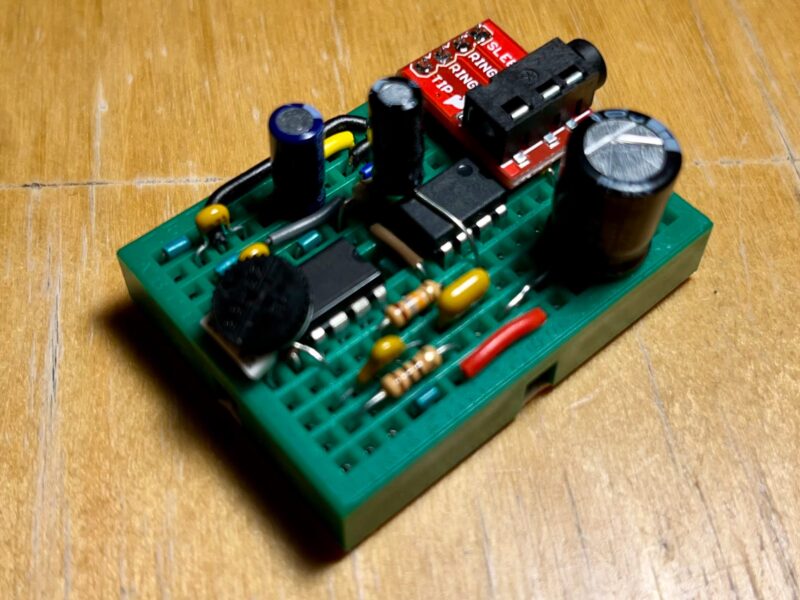
My friends think this photo looks AI-generated, but I assure you it’s real
Finally, I was able to hook up some speakers to my system and listen to some crisp, CD-quality music.
Chart loading
After implementing all the previous items, the last thing left to do was to import some existing Guitar Hero charts to play on the system. Thankfully, there’s a large online repository of these charts, which was super convenient.
The biggest challenge I encountered here was getting the timing just right. I had to calibrate a few songs manually for the project demo, but other than that, it works!
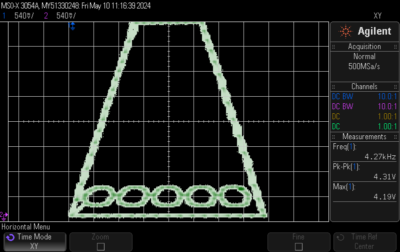
With all these components in place, I finally had a fully functional system:
I never thought I’d feel such happiness from seeing a few circles moving down a screen.
Challenges along the way
Of course, oscilloscopes and microcontrollers were not designed to play Guitar Hero, so I encountered two big challenges that almost killed this project.
The first was that I only had access to digital scopes, while oscilloscope-based games generally run on analog scopes. This might not seem like a big deal – after all, digital scopes are superior to analog scopes in many ways – but how they measure and render signals makes a huge difference when trying to render an animation.
Analog scopes use a continuous voltage measurement to trace an electron beam across a CRT display. This approach yields a super high (basically infinite) resolution and reacts to changes in the signal almost instantaneously. In contrast, digital scopes sample the voltage very rapidly (but not continuously!) and reconstruct the signal from those samples. This approach allows you to make fancy measurements on the signal that wouldn’t be possible on an analog scope but significantly worsens the resolution, speed, and maximum measurable frequency.
This tradeoff is usually not noticeable, but in my case, it just makes the graphics look… kind of bad, depending on which oscilloscope I used. Even worse, I couldn’t just average the signal for a long time to smooth out the image because of the real-time nature of the game!
The digital scope also limited my frame rate to 20 FPS. The signals I was feeding into the oscilloscope were very complex, so it couldn’t reliably display them when I went any faster.
This video demonstrates this effect, but here’s what it looked like in my initial tests:
Look at all those hideous rendering artifacts
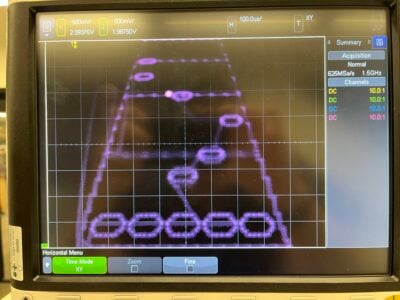
More rendering artifacts (i.e., the faint lines between the notes)
Luckily, human eyes are pretty bad, so it still looked decent after all this.
Still, I tried to create an optimized rendering algorithm to counteract these rendering effects, but that’s where I ran into my second problem – the microcontroller I was using struggled to handle all the intense computations I threw at it.
By the time I started optimizing the rendering algorithm, the microcontroller already had to:
- Read and play audio data from an SD card 44.1 thousand times per second.
- Compute the positions of 10+ game objects 20 times per second.
- Handle controller input 9.6 thousand times per second.
Because the microcontroller can only do one thing at a time, it can only output to the oscilloscope in the microseconds-short windows between these three events. Optimizing the rendering algorithm would only tighten these windows and potentially make the image flicker.
Furthermore, the microcontroller is about 250× slower than the computer you’re reading this blog post on, so even small slowdowns significantly degraded the game’s performance.
In the end, I created an algorithm that reduced the rendering artifacts but was still far from optimal. Ironically, this algorithm worked better on slower oscilloscopes that would theoretically render images worse.
Although these challenges almost killed my project, they were really what made this project so fun to work on. And they gave me plenty to discuss in my lab report!
As I write this blog, I realize that osu!lloscope would have made for a much better project name. Oh well, I suppose that will just have to be someone else’s final project in the future.
Update: Professor Leeb and all the TAs loved the project! Here’s one of the famous final project videos that they film each year.