
final exam distributions by Alice L. '24
"mit does not curve"
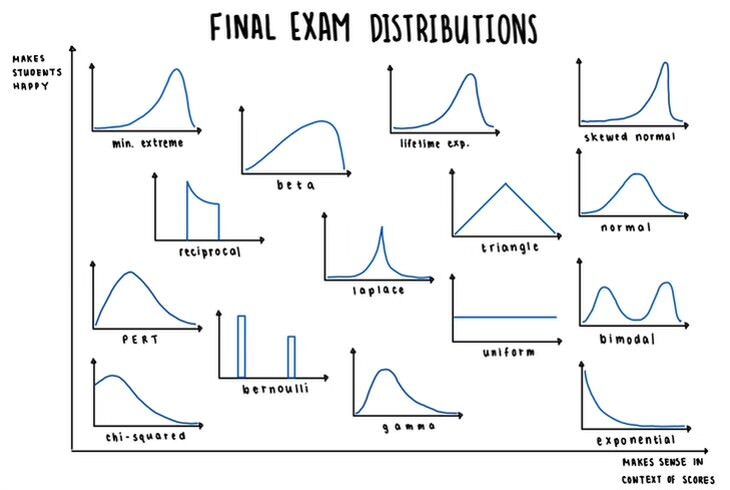
MIT technically “does not curve”, 01 but many classes will define cutoffs relative to class performance, which is more or less a curve; hence, increased happiness when everyone scores poorly together. so I’ve added some here to make up for it!
- but many classes will define cutoffs relative to class performance, which is more or less a curve; hence, increased happiness when everyone scores poorly together. back to text ↑