Anatomy of a Problem, Part 1 by Vincent A. '17
and the power of the few
6.046, Design and Analysis of Algorithms, is one of the most challenging classes I’ve ever taken. It’s a natural followup to MIT’s Introduction to Algorithms class, and dives into the heart of designing and understanding often complicated solutions to important computational problems, especially in the context of limited resources. Limited memory, limited processing power, limited running time, limited accuracy.
As a simple example, which we’ll come back to in a followup piece, suppose I gave you a list of numbers in some random order (say 3, 19, 2, 17, 14, 4) and I wanted you to sort it (so you would return 2, 3, 4, 14, 17,19), your ability to do this would depend on being able to directly compare 2 numbers and say things like “2 is smaller than 3” or “2 is smaller than 4”. What if your 2-number comparator was broken? What if you were saddled with a mental comparator that says “X is smaller than Y” and is accurate only 80% of the time? 6.046 is the kind of class that teaches you how to use this broken comparator and quickly produce a correctly sorted list 99.9999% of the time.
A lot of the material covered in 6.046 is dense, very fast-paced, and often inter-connected. At first, I was a bit worried about how I’d fare in the class, but after the first two problem sets (p-sets), I realized I actually quite enjoyed spending time on the problems. This mix of curiosity and determination often collided with pain, resulting in weeks where I’d spend up to twenty hours working on every last detail of every problem. I ended up averaging 100% on the p-sets and acing the class.
Most of the problems we explored involved applications of nontrivial algorithms introduced in class, resulting in p-set pages that often looked like this:
However, some of them, usually the problems that were stepping stones for more involved problems, could be figured out with a bit of thought and intuition, somewhat independently of the concepts formalized in lectures. In this post, we’ll explore one of them.
**
This particular problem was largely out of my mind and was brought into focus again by the recent presidential election in the United States. Donald Trump and Hillary Clinton both campaigned to become president. Hillary won the popular vote, earning roughly 2.8 million more votes than Trump, but he won the majority of the electoral votes, securing him the presidency. Dialogue in the media developed over implications of winning the majority of individual votes–by a sizable margin at that–and still losing the election. Structurally, it boiled down to an established political system, in which the final say is only tangentially influenced by the majority votes. I don’t intend to delve into my specific and pretty strong feelings about the recent elections but to set up an interesting point: structures of particular design, which seem poised to have decisions tangentially or directly decided by the majority, may produce non-intuitive results.
To illustrate this, imagine that you are the CEO of a prominent ice-cream company and you’re trying to figure out if you should roll out an innovative new flavor–maybe the Pineapple-Pizza on Vanilla ice-cream flavor. You decide to give out samples to as many test subjects as you can and use their opinions to make a final decision–Yes or No–on whether to initiate your nationwide rollout.
But you pride your company on its innovativeness, so instead of just having one person sample many test subjects and decide based on whether the majority of subjects like or dislike the flavor, you decide to divide test subjects into groups of 3, and have the “result” of each group reported to a manager. For any given group of 3, the group result will be “yes” if a majority of the 3 (so 2 or more) says “yes” and “no” if a majority of the group says no.
Now, these managers are split into groups of 3, and the majority result of each manager group gets communicated to higher-level managers, who are again split into groups of 3, and so on, and so on, until the final result is communicated to you, the CEO.
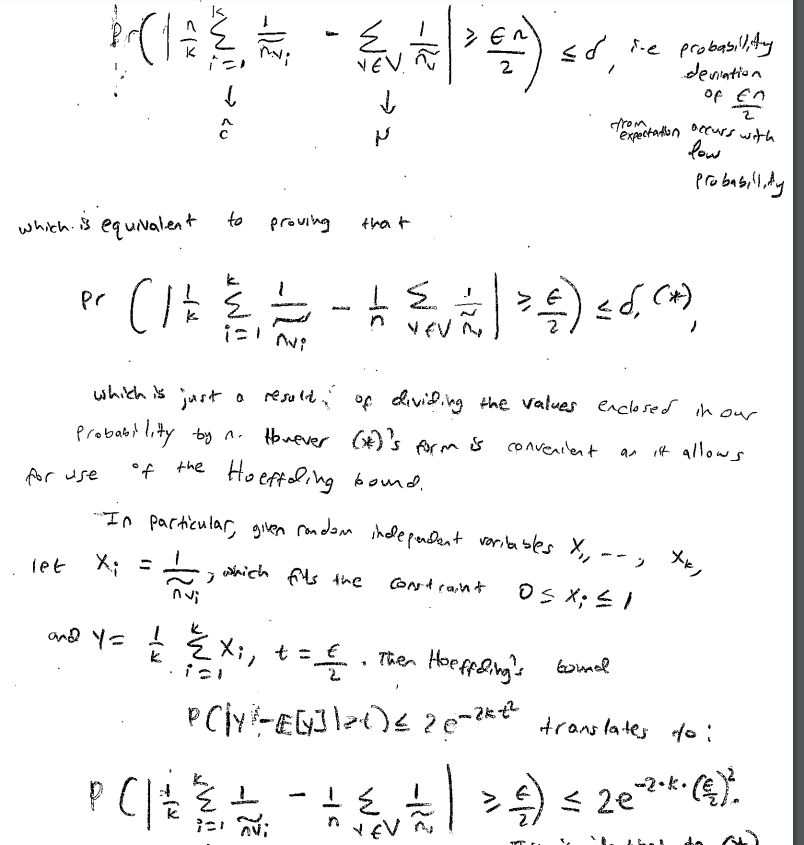
For instance, suppose you have 9 test subjects, whose responses are: Yes, Yes, No, Yes, Yes, No, Yes, Yes, No. Then the diagram below shows how the result travels up the chain of command to you. 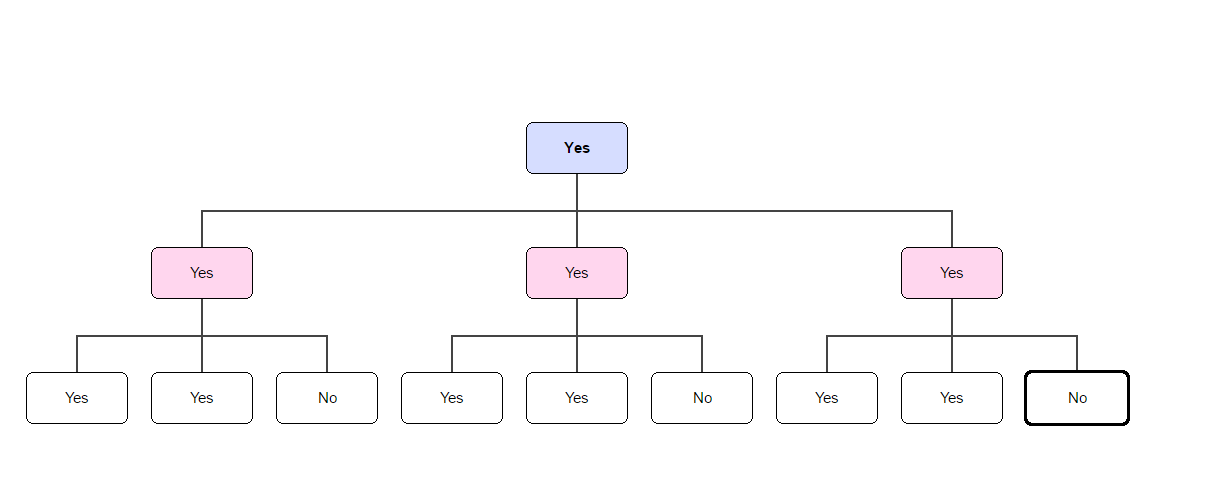
Each group of 3 test subjects “report” their majority vote to the manager (coded pink) above them, and each group of 3 managers reports their majority result to the CEO (coded blue). As you can see from the diagram, “Yes” is the majority for every group of test subjects; hence “Yes” is the result reported to the CEO, implying a rollout of the innovative flavor.
Here’s another diagram (you may need to zoom in), this time with 27 test subjects, who report to 9 managers, who in turn report to 3 managers, who in turn report to the CEO. This time however, “No” gets reported to the CEO and the flavor is not rolled out. Can you see why?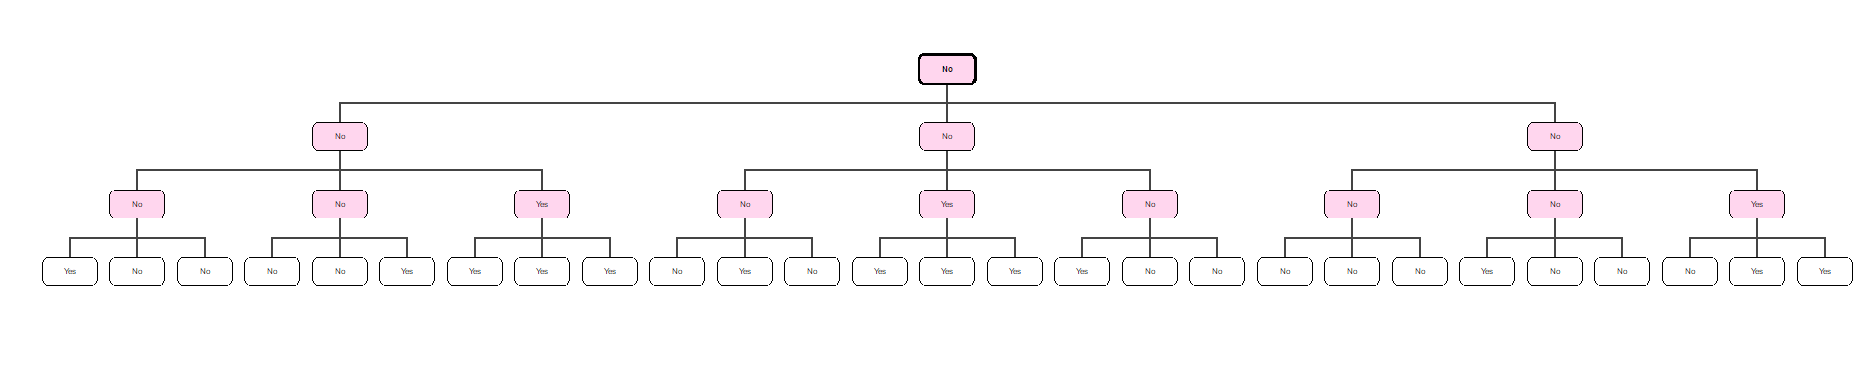 Notice that the first figure has 3 levels, whereas the second figure has 4 (horizontal) levels. We will call the topmost (CEO) level, level 0, the next level, level 1, and so on. In this way, level L contains 3L people.
Now, here comes the interesting part. Suppose we had 9 test subjects, like in the first picture. How many of these subjects hold influence over what gets reported to the CEO? Naturally, if all 9 of them say “Yes”, then the CEO will get a “Yes” result. What if only 8 of them say “Yes”? The CEO will still get a “Yes” result. How low can we go? What if only 4 of them say yes? That means 5 of them say no, and since we have more “No” answers than “Yes” answers, the CEO should get a “No” result, right? Wrong!
It turns out if only 4 out of 9 say “Yes”, the CEO can still potentially get a “Yes” result! Think of how this might happen for a moment, and then look at the diagram below.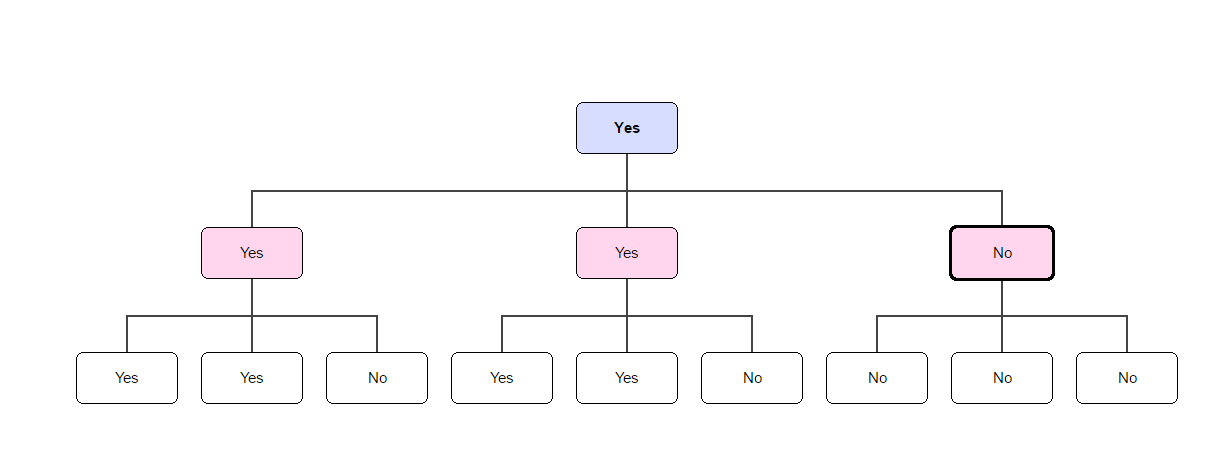
The level 1 managers have a “Yes” majority, even though the test subjects have a “No” majority, and therefore the CEO gets a “Yes” result.
It’s even more delicate than that. Observe that in the figure below, out of our 9 test subjects, we can pick 4 of them such that we can still ignore the answers of the remaining 5 subjects, whether those answers are “Yes” or “No”, and still know that the CEO will get a “Yes” result.
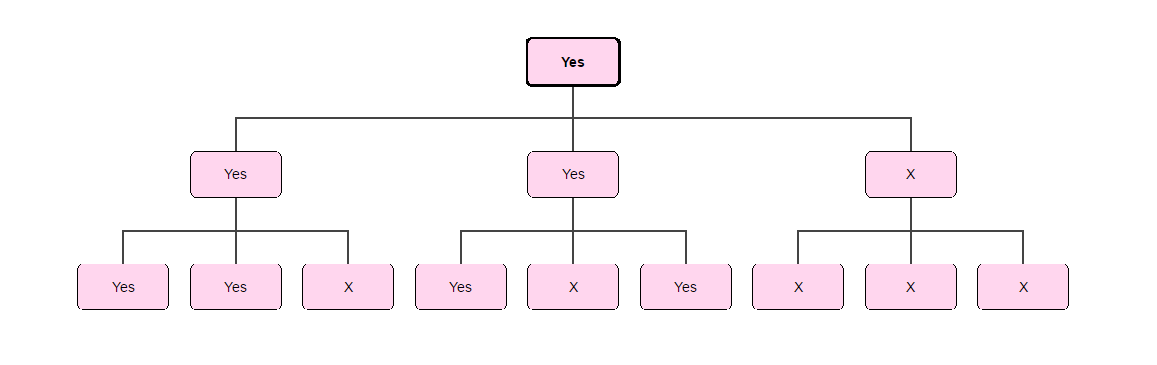
It doesn’t matter what the 5 test subjects whose responses have been crossed out say. As long as the remaining 4 agree on a single decision, this informs the decision the CEO gets. You might say 4 out of 9 is almost 50%, so that makes some kind of sense. It turns out we can’t do the same thing with 3–that is, we can’t pick 3 out of 9 test subjects (33%) whose agreement on a decision will ensure the CEO–i.e. you–adopts that decision as well.
You might therefore suspect that given a set of test subjects, there is a minimum percentage of them that you can pick such that if they all agree on a decision, this is the same decision the CEO adopts. Below this percentage, you might say, there is no such guarantee. It turns out this blatantly false. There is no such minimum percentage. In particular, although 4 out of 9 subjects can override the answers of the others, and 3 out of 9 can’t, this disparity widens the larger the number of test subjects. As an example, suppose you had about 14.3 million test subjects (to be precise 14,348,907 test subjects). How many of them do you think you can pick such that if the picked say “Yes”, then we know that the CEO is guaranteed to say “Yes”? 7 million? 5 million? It turns out you only need to pick slightly over 32,000 test subjects. Put differently, in a pool of 14 million test subjects, ~32,000 of them (or about 0.22% of them) are enough to force the CEO to agree with their decision, regardless of what the remaining 14,000,000+ say. To plug in the precise numbers, given a pool of 14,348,907 test subjects, I can pick 32,768 of them such that if they say “Yes”, and the remaining 14,316,139 of them say “No”, the CEO will end up saying “Yes”, which sounds a little insane.
It turns out this is not as surprising as it initially seems, with just a bit of thought. The general rule here is that if we have 3K test subjects, then we can pick 2K of them whose consensus decision overrides the decisions of the remaining test subjects. Now, when K = 15, you’ll see that 215 = 32,768 while 315 = 14,348,907. We were tasked with proving this general rule for a small portion of the problem set (and shortly had to develop a randomized algorithm that utilized this rule).
**
Let K = 1. Then our rule just says that given 31 = 3 test subjects, I can pick 21 = 2 of them such that whatever they decide is what the CEO ends up deciding (and in this case, this is actually a majority decision). Now, when K=2, we have 22 = 4 out of 32 = 9 test subjects having this kind of influence. As the value of K increases (to 15, 1000, 2000…) the percentage of “influential” test subjects gets arbitrarily smaller, but this percentage still obeys our rule.
Let’s see why.
Suppose we have 3K test subjects. Then there would be K+1 levels in our diagram (level 0 for the CEO, level 1 for the 3 topmost managers, level 2 for the 9 subsequent managers, and so on, until we get to level K for our test subjects). Next, consider some level J, where J is any whole number between 1 and K+1. There will be 3J people at this level, some of whose decisions influence the decisions of some of the 3J-1 people at the upper level (for example, the decisions of the first 3 people in level J will influence the decision of the first person in level J-1). More formally, we can pick 2J people at level J whose “Yes” or “No” values determine the “Yes” or “No” values of some 2J-1 people at level J-1.
The reasoning for this is a little tricky, but here goes: consider the 3J-1 people at level J-1. Since each of them will either have a “Yes” or a “No” value, a majority of them will have the same value–that is, at least (3J-1 + 1)/2 will have the same value, and because (3J-1 + 1)/2 is greater than 2J-1, then at least 2J-1 people on level J-1 will have the same “shared value”. The “shared value” for each of these 2J-1 people, E, must have been determined by a majority of the 3 people on level J directly below E–that is, must have been determined by at least 2 people on level J. This implies that, on level J, there are 2 * 2J-1 = 2J people who determine the shared value for 2J-1 people on level J-1.
If we understand that 2J people on level J determine a shared value for 2J-1 people on level J-1, we can build a “chain of dependency”–2J-1 people on level J-1 determine a shared value for 2J-2 people on level J-2, who in turn determine a shared value for 2J-3 on level J-3,…, and so on, until we get to the end of our chain: 21 people on level 1 determine a shared value for 20 = 1 person on level 0 (the CEO). Therefore, 2J people on level J, for any J > 0, determine the CEO’s value. Hence, when you have 3K test subjects on level K, 2K of them will determine the CEO’s decision, and when K = 15, this amounts to a particular group of 32,000 people overriding the values of 14,000,000 people.
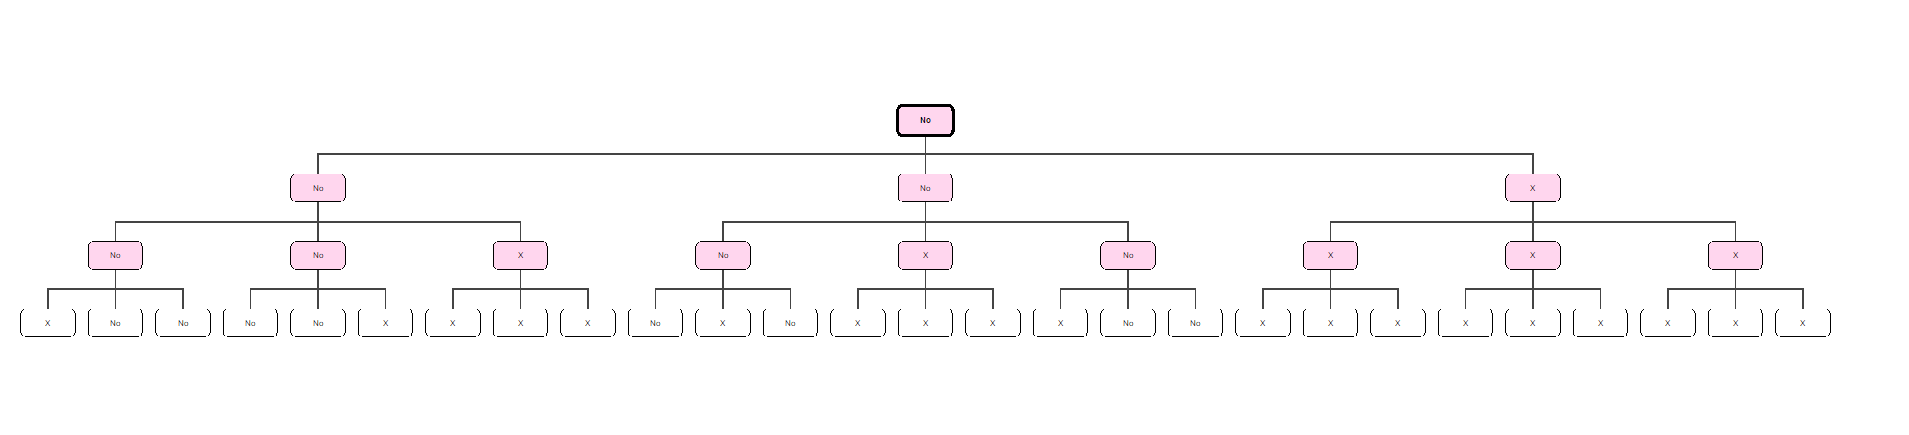
More visually, when K = 3, this amounts to 8 out of 27 people influencing the final decision, as shown in the diagram below (you may need to zoom in). Observe that regardless of what the remaining 19 crossed out test subjects say, 8 test subjects have already determined what value the CEO gets.
This is a not-immediately-intuitive result of a seemingly intuitive “majority-aggregation” structure, and if you’re so inclined, I’m sure you can mine some amount of social commentary from an experiment like this. In a subsequent blogpost, I’ll be discussing a somewhat related concept that arose in 6.046, albeit one that’s slightly more involved. Until then, folks.