Confusion, by the Numbers by Kathleen E. '23
my high school experience, via a google doc and some python

(Credit: Drone footage by Matt Carney, taken from Henry DaCosta’s 2016 Senior Video.)
Five months ago, I bid farewell to my high school, Ward Melville. In my three years there, I changed intellectually and emotionally in ways I couldn’t have predicted. I spent this past summer reflecting on these changes. How did I change, and what changed me? How and why did I persist when things seemed impossibly hard? Was high school even really as difficult as it felt?
I found a deep appreciation for how my many “failures” served as catalysts for personal growth. In the wake of setbacks and mistakes, I gained resilience and principle. My freshman year at MIT has brought its own set of failures. It’s hard not to get hung up on my mistakes, but if high school taught me anything, it is that these failures are gifts that will lead to successes down the road.
comic by Reza Farazmand
Throughout high school I was often lost in confusion. I like to think about confusion as a feeling that comes in many different flavors. Some are sweet and others are bitter. I liked being confused by interesting projects and the process of making new friends. I hated being confused over tedious busywork and dysfunctional relationships.
Confusion was motivation to understand the world. To un-confuse myself I had to push myself out of my comfort zone. Navigating unknown territory – be it a school project, a tough debate round, or interactions with an overly-sarcastic friend – made me think differently. Being lost in confusion was a good thing.
In my senior year, I used a Google Doc as an agenda to keep track of my assignments. I used a Google Chrome extension called Draftback to extract a log of my editing history on my agenda. The log contains every instance that my confusion grew (when I would add an assignment) or lessened (when I removed the assignment).
I analyzed the log and made six figures to summarize my senior year. Some of the figures present “real” data, collected from my agenda, and others have “fake” data, collected from my memories, to describe my time at Ward Melville. To analyze the data, I wrote some code in Python in a Jupyter Notebook (via Anaconda). My data and code can be viewed here.

Figure 1: Daily Activity
I made a box-plot to visualize the distribution of my revisions over each week. Unsurprisingly, I spent more time editing my agenda during the week and less time on weekends.
Figure 2: Types of Revisions
What kind of revisions was I making? Draftback didn’t have this data. Moreover, it’s not clear what Draftback counts as 1 revision, so I don’t know exactly what Wednesday’s “median of 50 revisions” means.
I know I spent some time using the agenda for its most basic purpose: adding and removing assignments. However, I probably spent most of my time doing unnecessary (but very fun) formatting and maintenance on the text. My agenda created plenty of opportunities for me to play with categorization, text alignment, fonts, and colors.
Figure 3: Activity for One Year
The beginning of my senior year was much more intense than the end. How did my editing history change over the course of the entire year? I plotted a bar graph with the total number of revisions per day for my entire senior year (beginning in November when I started using the agenda). Each Sunday is marked with a gray vertical line.
I stopped worrying about my agenda (and school) during my college application cram and science olympiad trips. Other times, like during AP week, I made hundreds of revisions a day. Even though I felt that the second half of senior year was easier than the first, my activity was much higher in the spring than in the fall.
click to enlarge
To make this plot, I used a Pandas tool called “date reindexing” to add missing dates (days when I didn’t edit the doc at all) into the log (with a value of zero for the number of revisions). Date reindexing made it possible to visualize a weekly pattern in my activity. If some weeks had missing days, it would destroy the spatial structure of a week on the graph, making this pattern less apparent.
Figure 4: Hourly Activity
How did I spend each day? I took a sum across days to find my total number of revisions by hour. I was surprised at how high some bars were in the early morning (2AM-5AM).
Figure 5: Confusion Levels by Class
During school hours, my editing activity related to how I felt in class. If I was bored, I would mess around with colors and highlighting and ignore the lecture. If I was scrambling to take notes, I less likely to make revisions.
Some of my classes were more confusing than others, either because of difficult content or a lecture style I couldn’t process. As I said before, confusion comes in different flavors. The magnitude of the bars for periods 7 and 8 may be similar, but during period 7 (differential equations) my confusion stimulated my curiosity, while during period 8 (French) my confusion made me frustrated.
Figure 6: Hourly Activity by Day
How did my hourly activity change over the course of a week? I plotted instances of revisions by time and day of week. Some aspects of my weekly schedule instantly popped out at me:
- Weekdays 7:00-14:00 had an abundance of edits during the school day
- Weekdays 9:00-10:00 had a lack of edits during orchestra, when I was not on my laptop
- Friday 19:00-23:00 had a lack of edits while I went to art and music lessons
- Monday 1:00-2:00 had an abundance of edits when my weekend procrastination caught up to me
- Weekdays 17:00-19:00 had a slight lack of edits for nap time
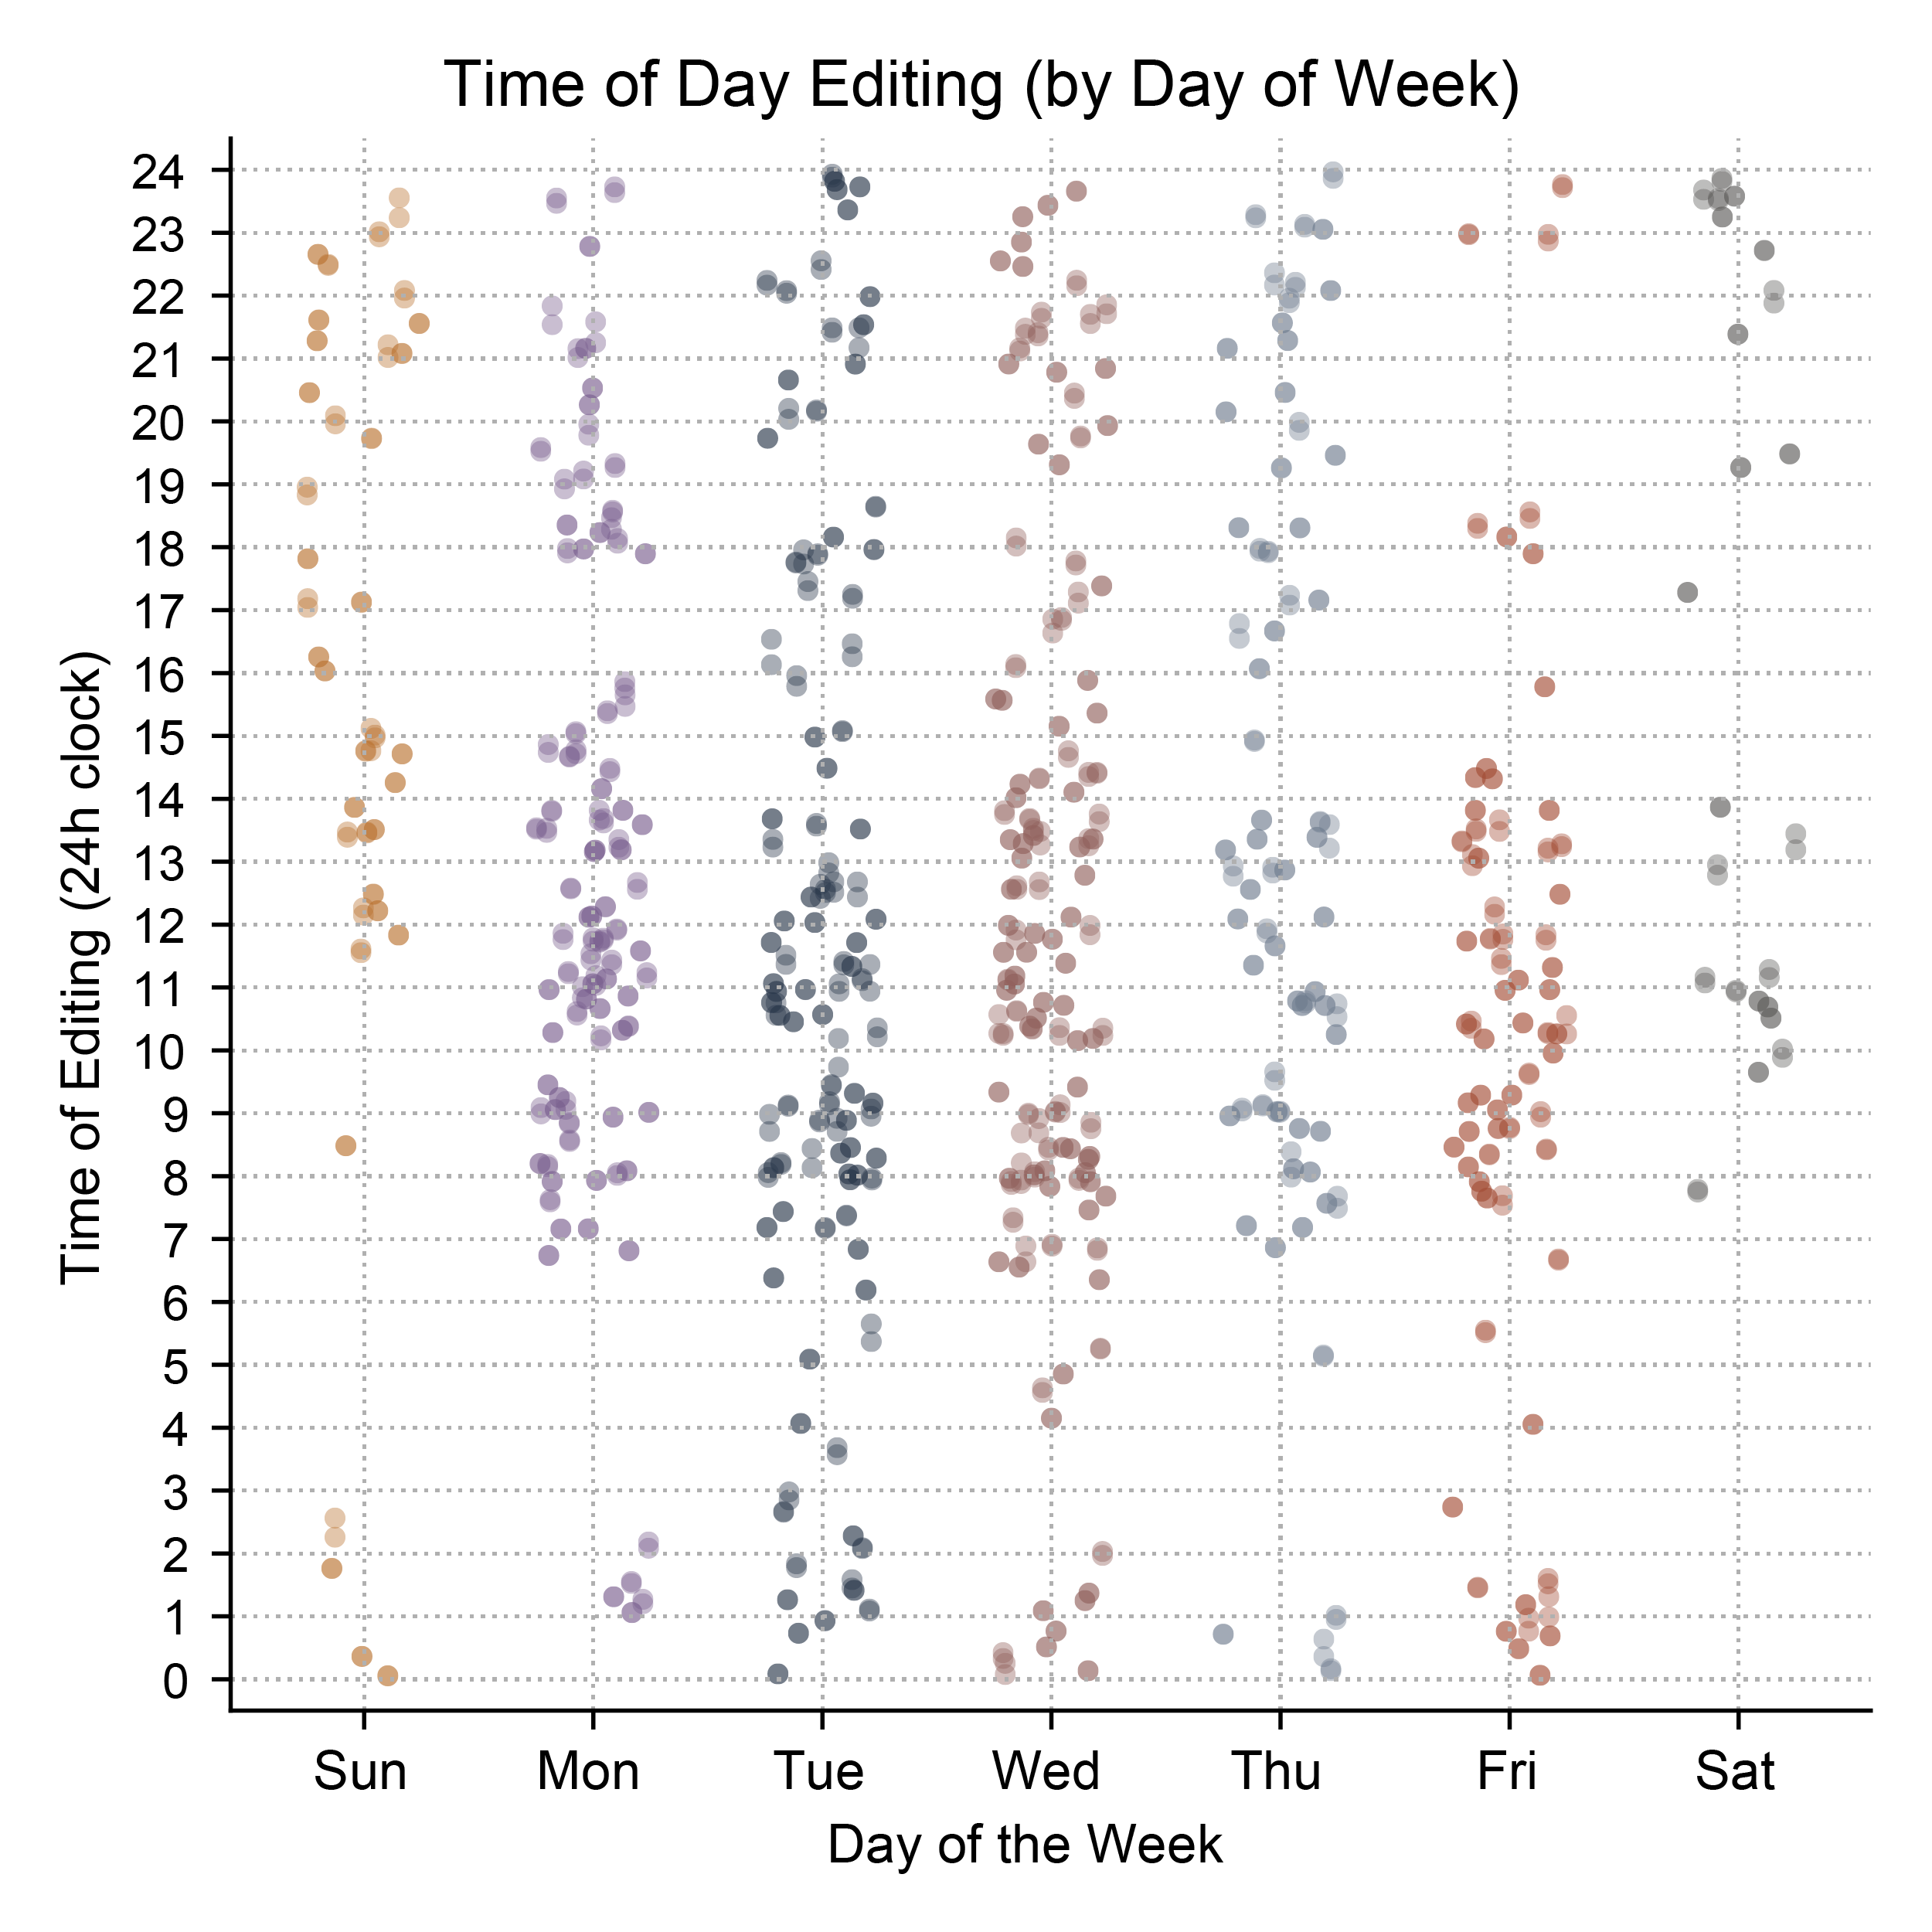
To make this plot, I had to “jitter” the dots a bit over the x-axis. The jittering (or scattering) increases visual clarity by separating points which would otherwise be stacked on top of each other.
Was it all worth it? My data shows me that I was up at nearly all hours, taking on assignment after assignment. The data tells me nothing about what I really got out of all of the confusion.
High school is what you make of it. I chose to make high school quite difficult for myself. I took on more than I could handle, year after year. I learned that with enough time and effort, anything is possible. At times I pushed myself too hard, and I learned how painful it is to be sleep deprived for weeks on end; how sad it is to stay indoors nearly all the time; how lonely it is to barely see my friends outside of class. I should have searched for a healthier balance between school and everything else. Finding this balance has become my priority, and I’m much happier now.
MIT is confusing in many more ways than high school was. There are more chances to make mistakes and fewer support systems to help me up when I fall down. My newfound independence is a gift and a responsibility that I haven’t quite found a way to navigate. I know in a month, or a year, or three years, I’ll look back on this post and have more answers. In the meantime, I’ll keep asking questions, making mistakes, and savoring all the different flavors of confusion.