
dormspam-the-game (Part 2) by Kathleen E. '23
may the data be ever in my favor
For five weeks this summer, I competed in dormspam-the-game, a series of 5 games played by the MIT community. Playing the games was straightforward, but winning them was not. The top-ranked players of each game were not determined by an objectively “correct” answer. Instead, a winning response was determined by the collective responses of all the other players. This might be a little unclear, but don’t worry – I explain it better later in the post, when I discuss the rules for each game.
I somehow managed to place 3rd overall,01 To be completely accurate, I actually had the 4th-highest score, but since the person who placed just above me won 1st place for an individual game, he was removed from the overall rankings to progress to the live game show. Thus I ended up 3rd and won $15 along with the other top ten scorers. winning a small prize of $15. In my last post, I wrote about Game 1: Hide and Seek. Here in Part 2, I’ve analyzed the remaining four games, hoping to gain more insight into each game and figure out how much luck played into my performance.
The 5 Games:
- Game 1: Hide and Seek (from my previous post)
- Game 2: Greed Control
- Game 3: Sleep, Social Life, School
- Game 4: Dormitory Vacancies
- Game 5: Institvte Fundraising
Game 2: Greed Control
Rules
- You are a student at MIT.02 which stands for Missouri Institute of Taxidermy, in dormspam-the-game You live in a dorm where each resident has a score that determines their priority in room selection. Your goal is to maximize your score.
- Your score is calculated using two factors: (1) your selection of 5 integers and (2) the frequency with which all other students chose those integers. Each player will select 5 integers in the range 1 to 50, inclusive. For each integer k you select, the number of points you receive will be k / (the number of times k was chosen by all the players).
- I mentioned at the start of this post that winning wasn’t straightforward and that doing well depended on the collective responses of the other players. You can see that quite clearly in this game, where maximizing your score would mean choosing a set of integers with the greatest values (which you do know) and the lowest popularity (which you don’t know).
Analysis and Visualization
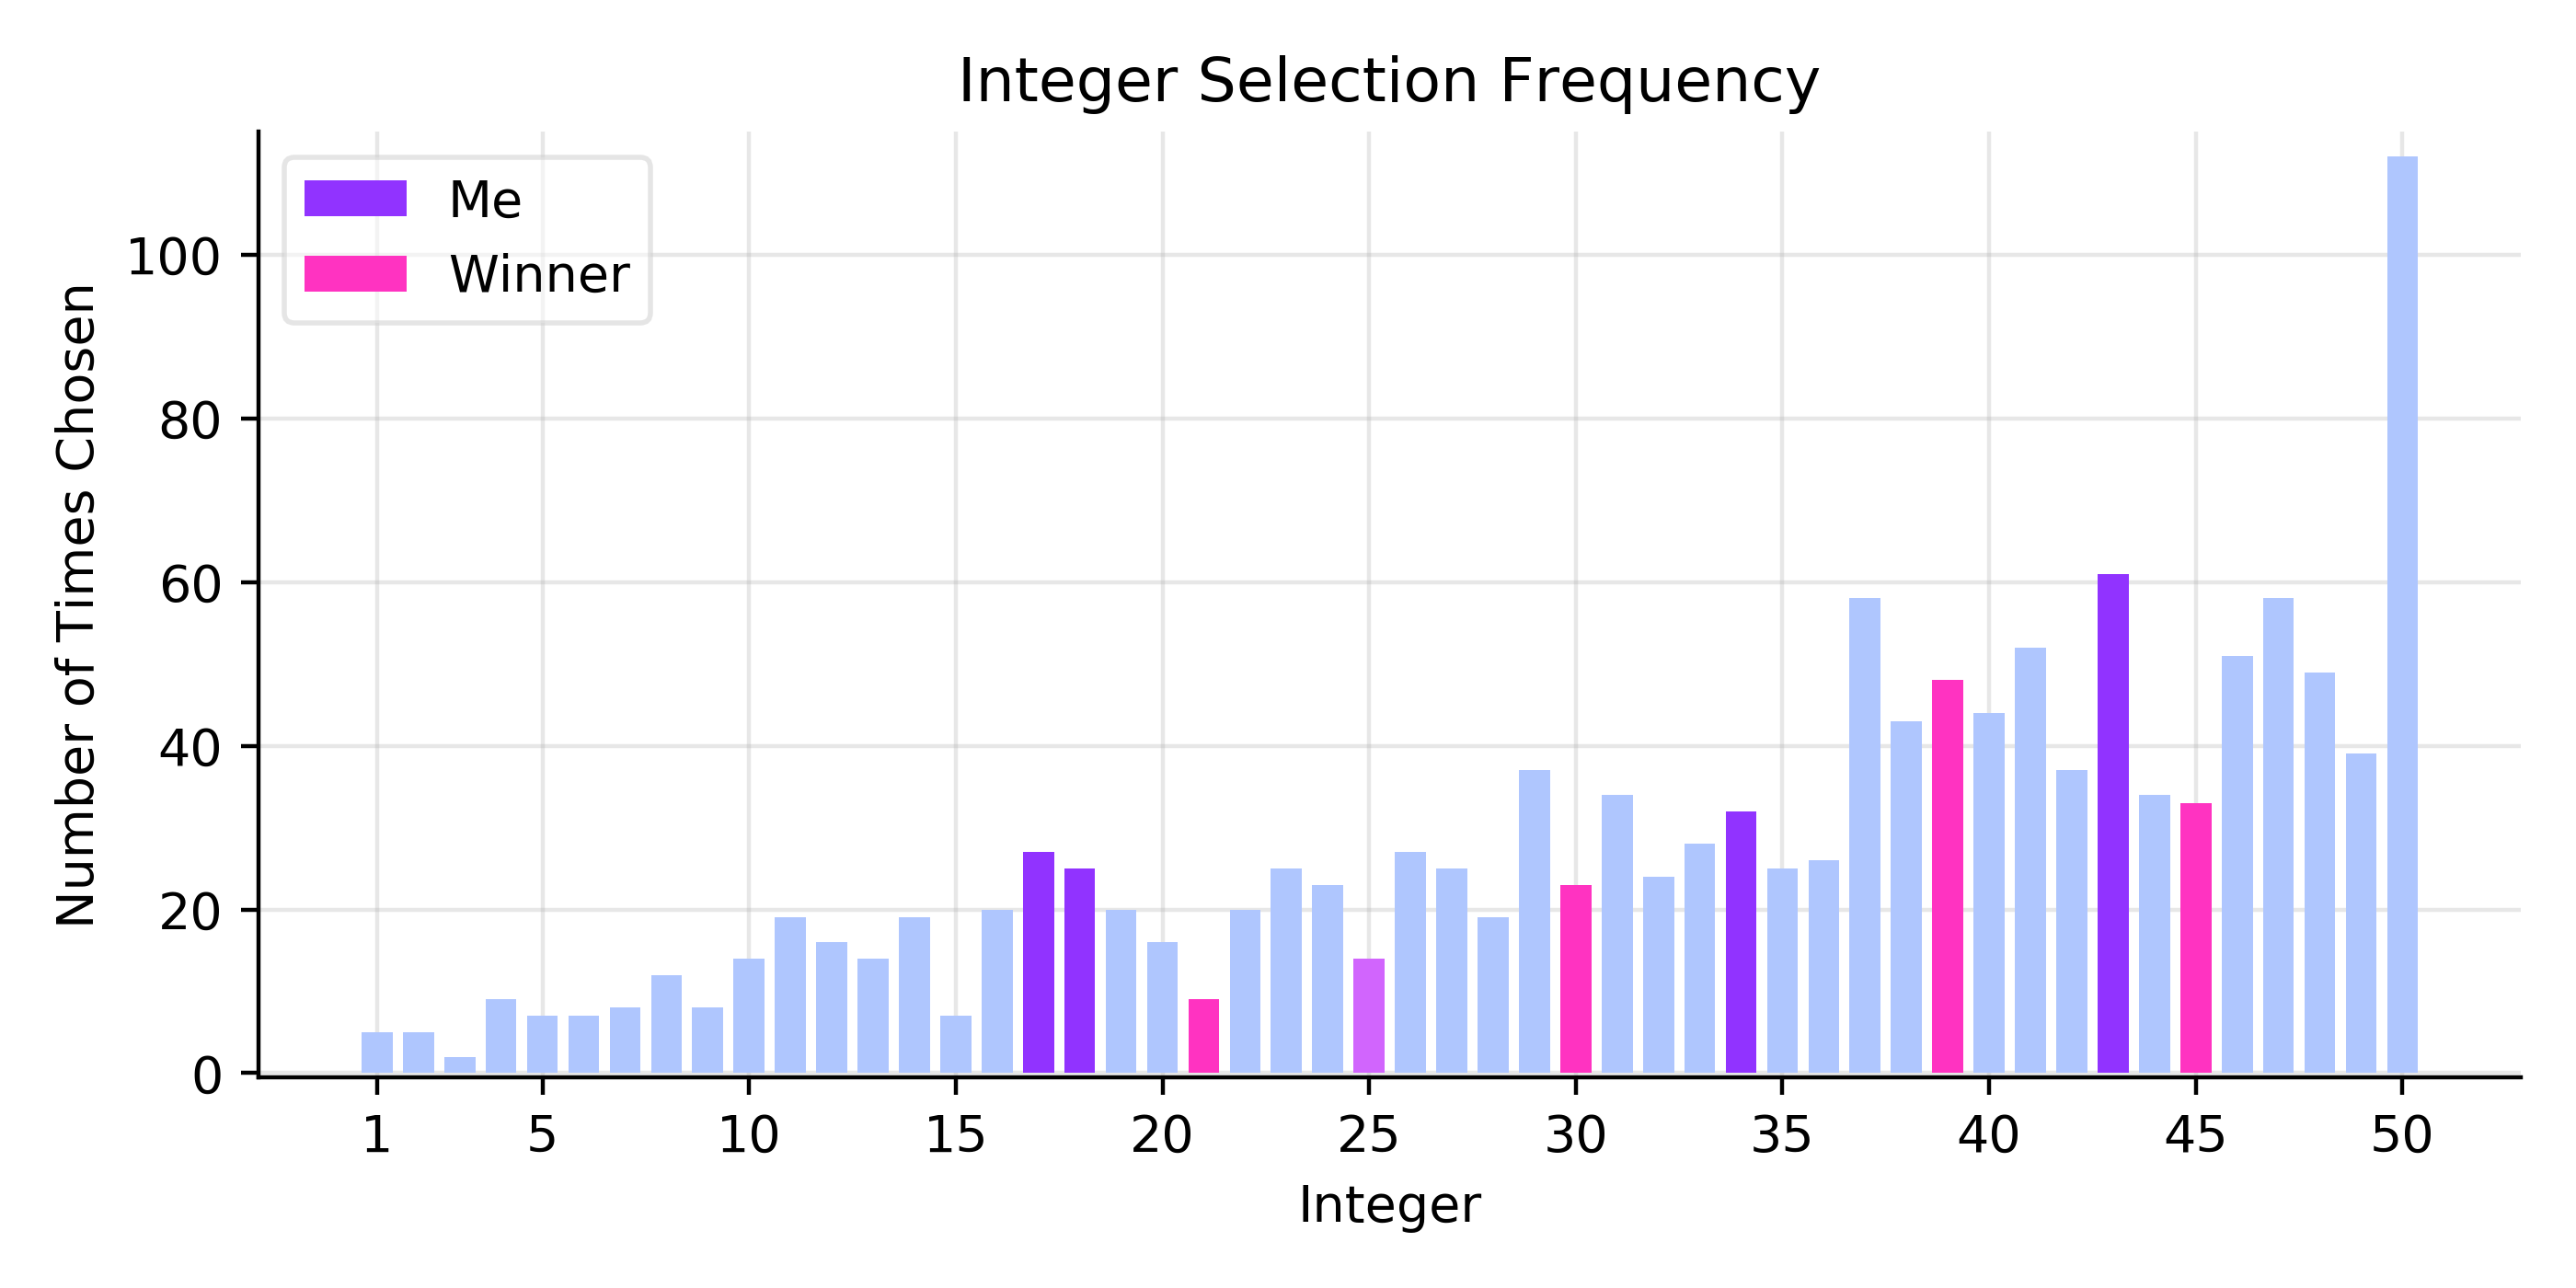
I chose {17, 18, 25, 34, 43}, which generated a total score of 4.9 points. I placed 95th out of 274 players. The winner chose {21, 25, 30, 39, 45}, for a total score of 7.6 points. In the figure below, I show the selection frequency aggregated across all the players and highlight both my and the winner’s choices.
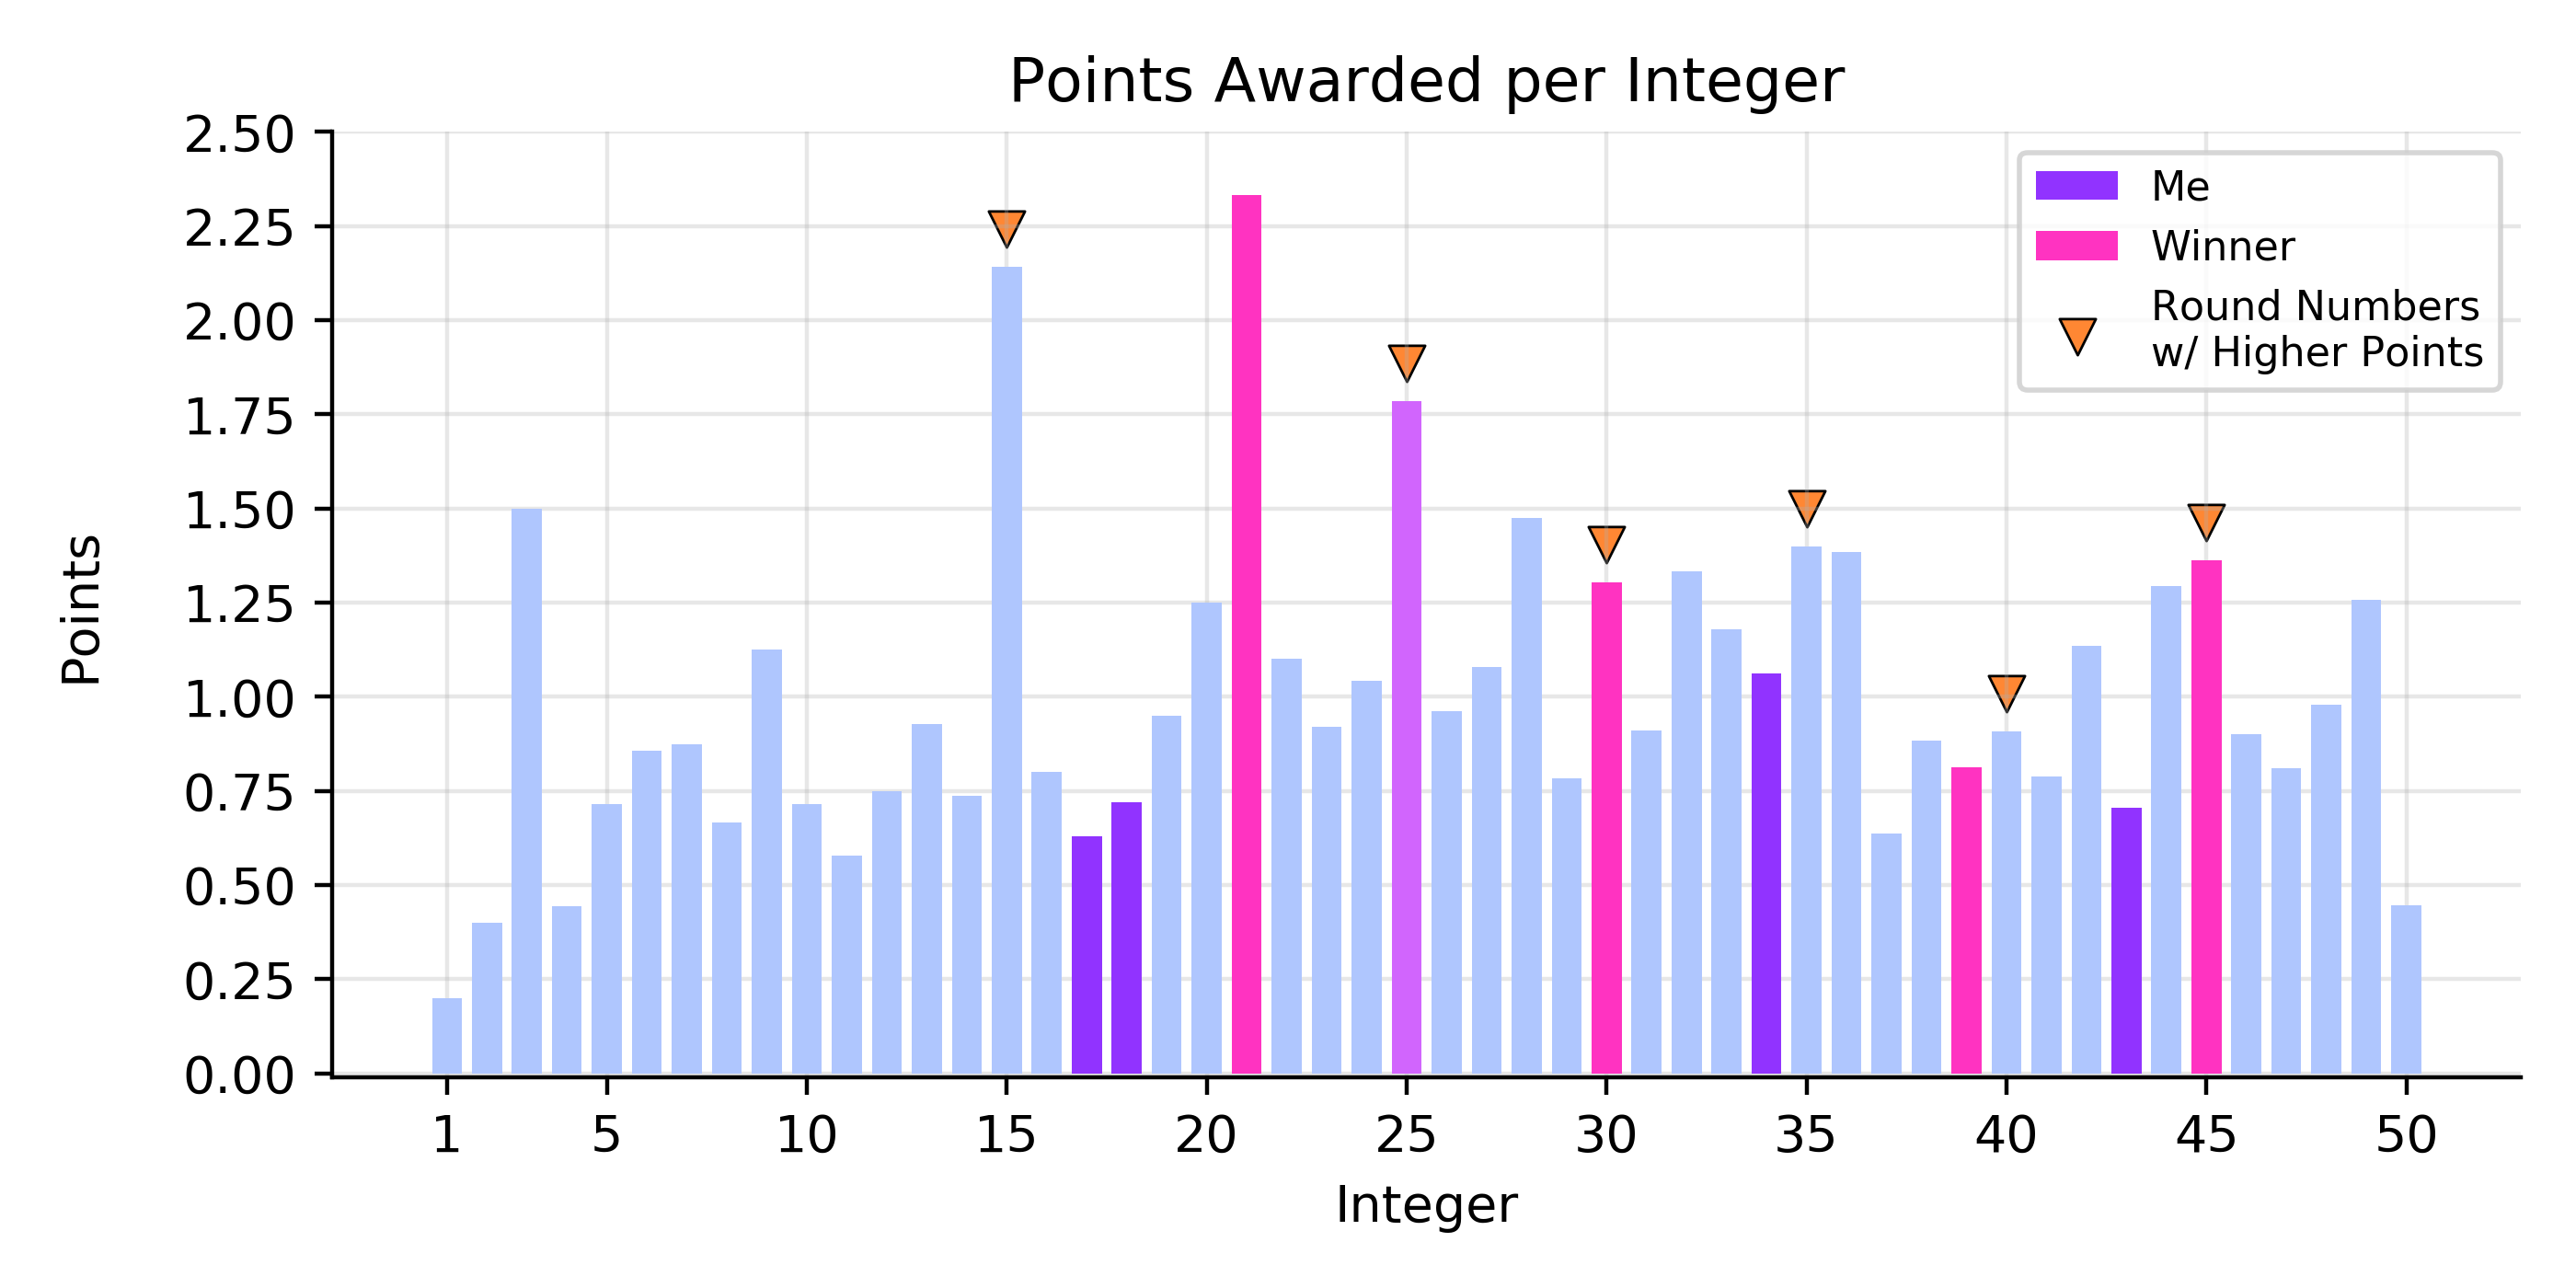
 My first consideration in making my selection was predicting which values might have a low selection frequency. I thought that “round” numbers (those with 0 or 5 in the ones place) might show some trend of being more preferred by the other players, so I decided to pick only one “round” value (25). However, this ended up being the opposite of the actual trend; the round numbers tended to have a lower selection frequency than their immediate neighbors, resulting in them carrying more points. The winner picked three (25, 30, 45) round numbers. In the figure below, I show the points carried by each integer, highlight both my and the winner’s choices, and note the round values which had a higher frequency than their immediate neighbors.
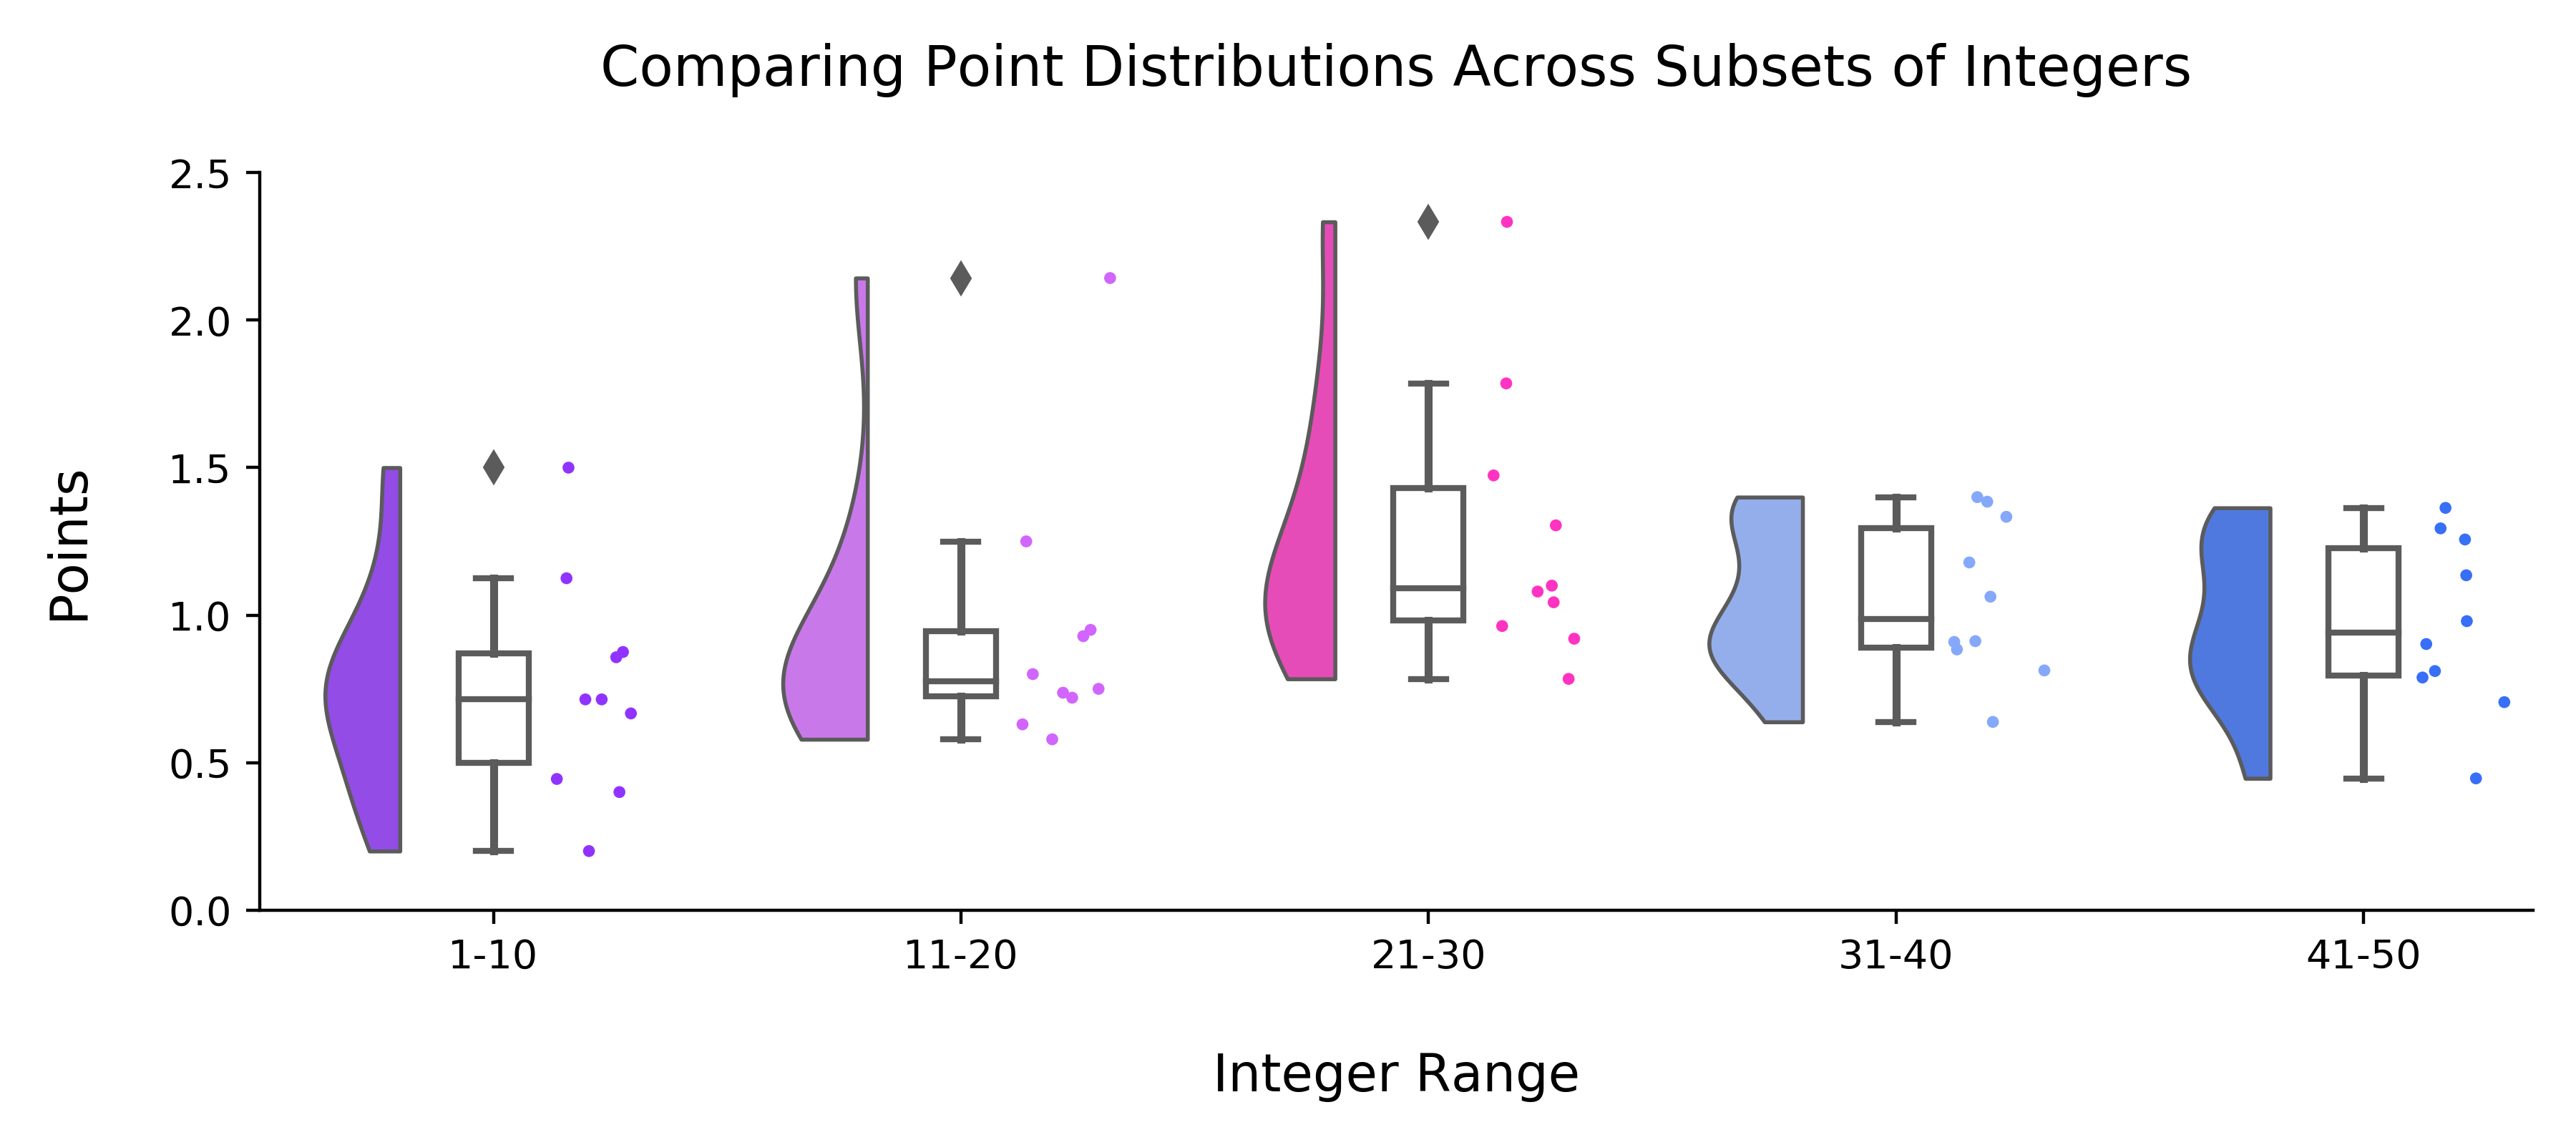
My second consideration was to avoid picking from the extremes of the 1 to 50 range. I avoided the lowest values because, assuming selection frequency was somewhat uniform across the range of integers (which did not actually happen, as we saw above), higher values would deliver more points. I avoided the highest values because I figured that more people would choose them, resulting in them carrying a low number of points. This ended up working well. As shown below (in a raincloud plot), the middle values tended to have higher points than the extremes.
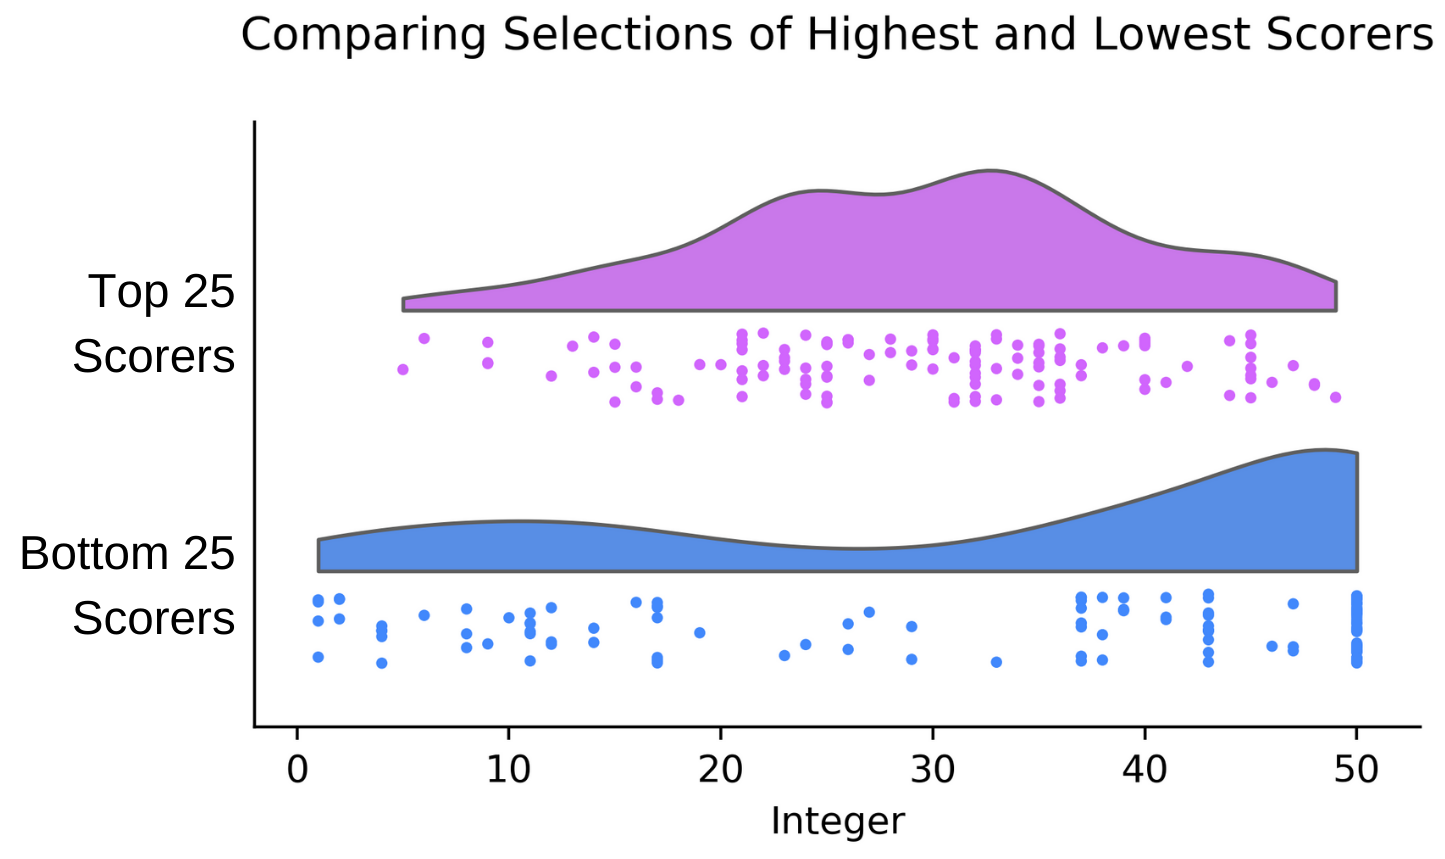
 As expected from the plot above, the 25 players with the highest composite scores tended to select from the middle range, while the 25 players with the lowest composite scores tended to select from the extremes (as shown in the figure below). My strategy of avoiding the extremes was a good move!
Game 3: Sleep, Social Life, and School
Rules
- You are a student at MIT. You have 100 points to allocate across three categories: sleep, social life, and school.
- MIT wants to identify the best student. They will do this using three rounds of evaluations in which you are compared with other students using your scores from the categories mentioned above (sleep, social life, and school). Each round involves only one category of comparison. You rank higher if you allocated more points to that category than the other student(s) with which you are being compared.
- In Round 1, they’ll take your highest characteristic, and rank you against all the other students.
- In Round 2, they’ll choose a random characteristic, pair you with one random student, and calculate a score using (your points for that characteristic – the other student’s points for that characteristic). Then, this score will be used to rank you against all other students.
- Round 3 is identical to Round 2 (you will be paired with the same student), except a different characteristic will be chosen.
- After the three rounds, the rankings are combined to get a final score, calculated as (best rank + second best rank + (2 * third best rank)). The student with the lowest overall score will be named the best student.
Analysis and Visualization
Similarly to the last two games, winning is very clearly predicated on the responses of all the other competitors and is luck based. However, this game stood out to me as different for two reasons:
- Firstly, this game was unfair in that two players could submit the exact same values but be ranked differently due to randomization in the pairing used in Round 2 and 3.
- Secondly, I felt players could strategize more about this game than the previous two games. For example, in sliding between the two extremes of distributing points evenly or putting them all into one category, there was a shift in how one might perform: “generalizing” reduces overall risk Round 2 and 3 while “specializing” reduces risk in Round 1.
I chose sleep = 69, social life = 20, and school = 11. I placed 5th out of 212 players.
Since I allocated the most points to sleep, for Round 1, I was ranked against everyone else’s sleep score and ended up 42nd. For Round 2 and 3, which were chosen to be school and social Life, respectively, I got extremely lucky. I was paired with someone who had allocated their points as sleep = 100, social life = 0, and school = 0. This meant that I was able to retain all of my points during the intermediate step when their points were subtracted to mine prior to everyone being ranked. I ended up ranking 65th in Round 2 and 48th in Round 3. This gave me a final score of 220.
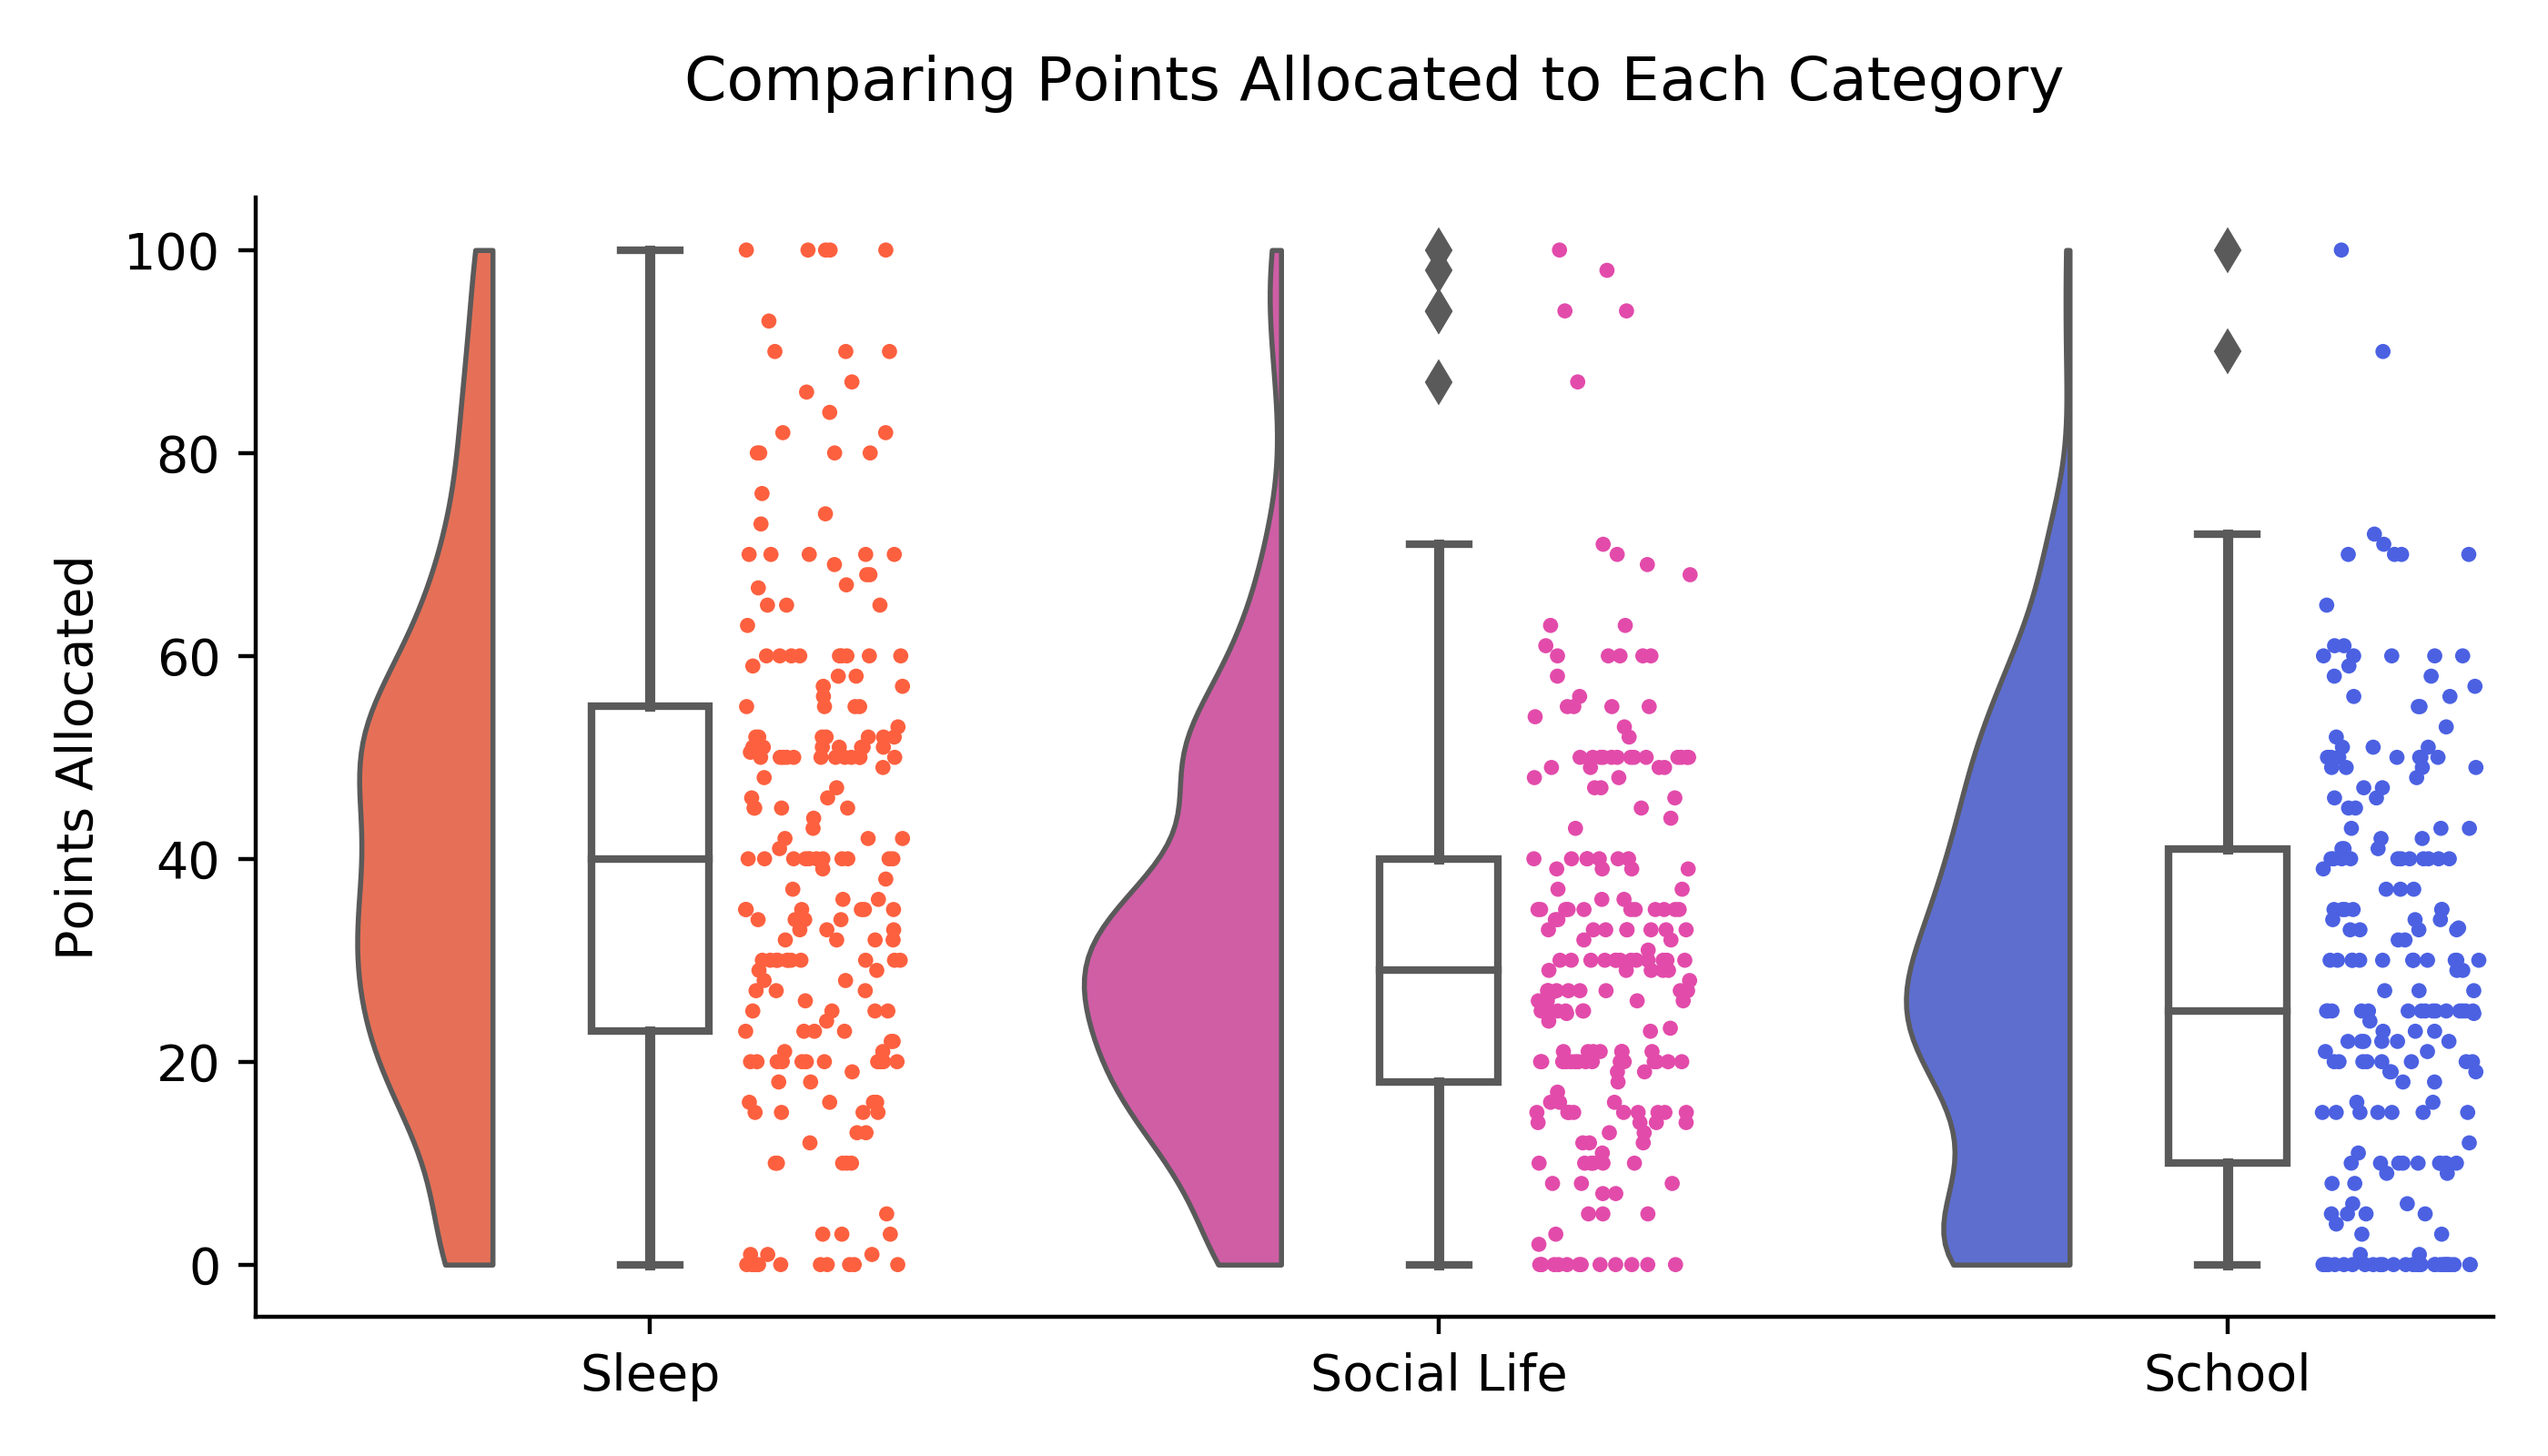
Based on their point allocations, MIT students appeared to value sleep (median = 40) the most, followed by social life (median = 29), then school (median = 25). It definitely feels like the opposite ranking, in reality – an alternative interpretation of these rankings is that maybe more people allocated more points to sleep and social life because they assumed others would put lower values for those categories.
 The final composite scores would be very different if Game 3 was run again (with the same data), since rankings in Round 2 and Round 3 were largely determined by the randomized pairing with another student.
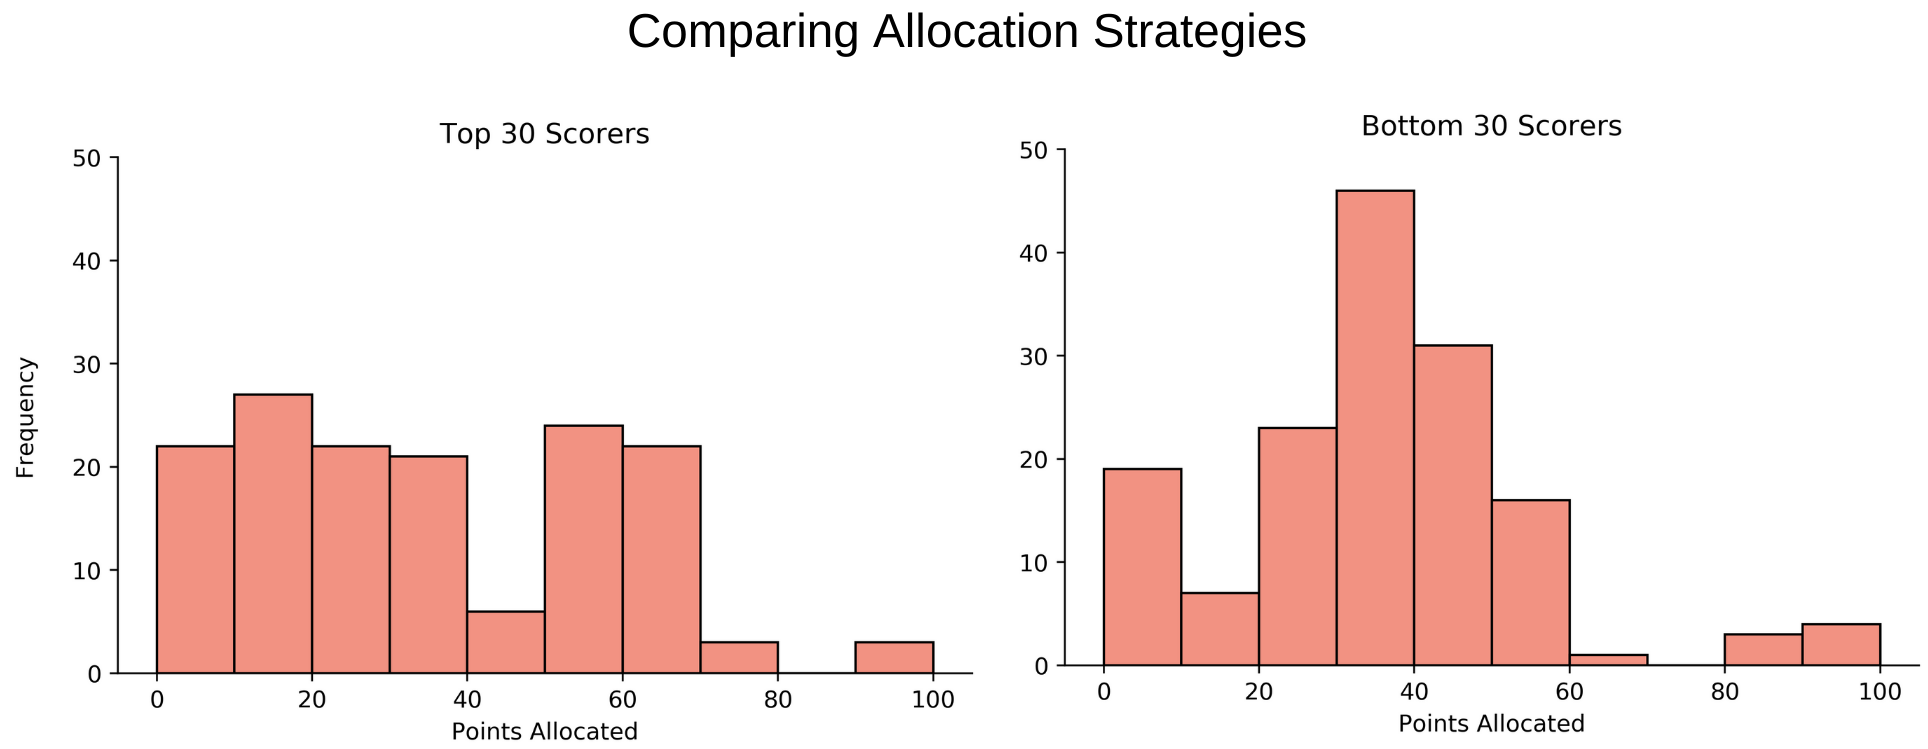
However, there were some trends in that would likely persist across different iterations of this game, in terms of how point allocation strategies corresponded with winning. The top scorers were those who specialized, but not too much, meaning that they tended to give more than 50 points to one category, but not over 80. Meanwhile, the bottom scorers tended to be those who either specialized to the extreme (allocating over 80 points to one category) or strongly generalized, allocating a similar number of points (30-40) across the three categories. My allocations of 11, 20, and 69 points fit the characteristic profile for a top scorer.
Game 4: Dormitory Vacancies
Rules
- You are the player. You aim to estimate how many students will want be on campus next semester, given that there are 4,000 students at MIT and we are enduring a pandemic.
- MIT will collect the estimates from all the players, and then prepare for a number of students equal to 90% of the mean guess to come back.
- Your score will be the absolute value of the difference between your guess and MIT’s calculation of 90% of the mean. The lower your score, the better.
- As a tiebreaker, you will guess the standard deviation of all guesses. Your tiebreaker will also be evaluated as 90% of the mean guess.
Analysis and Visualization
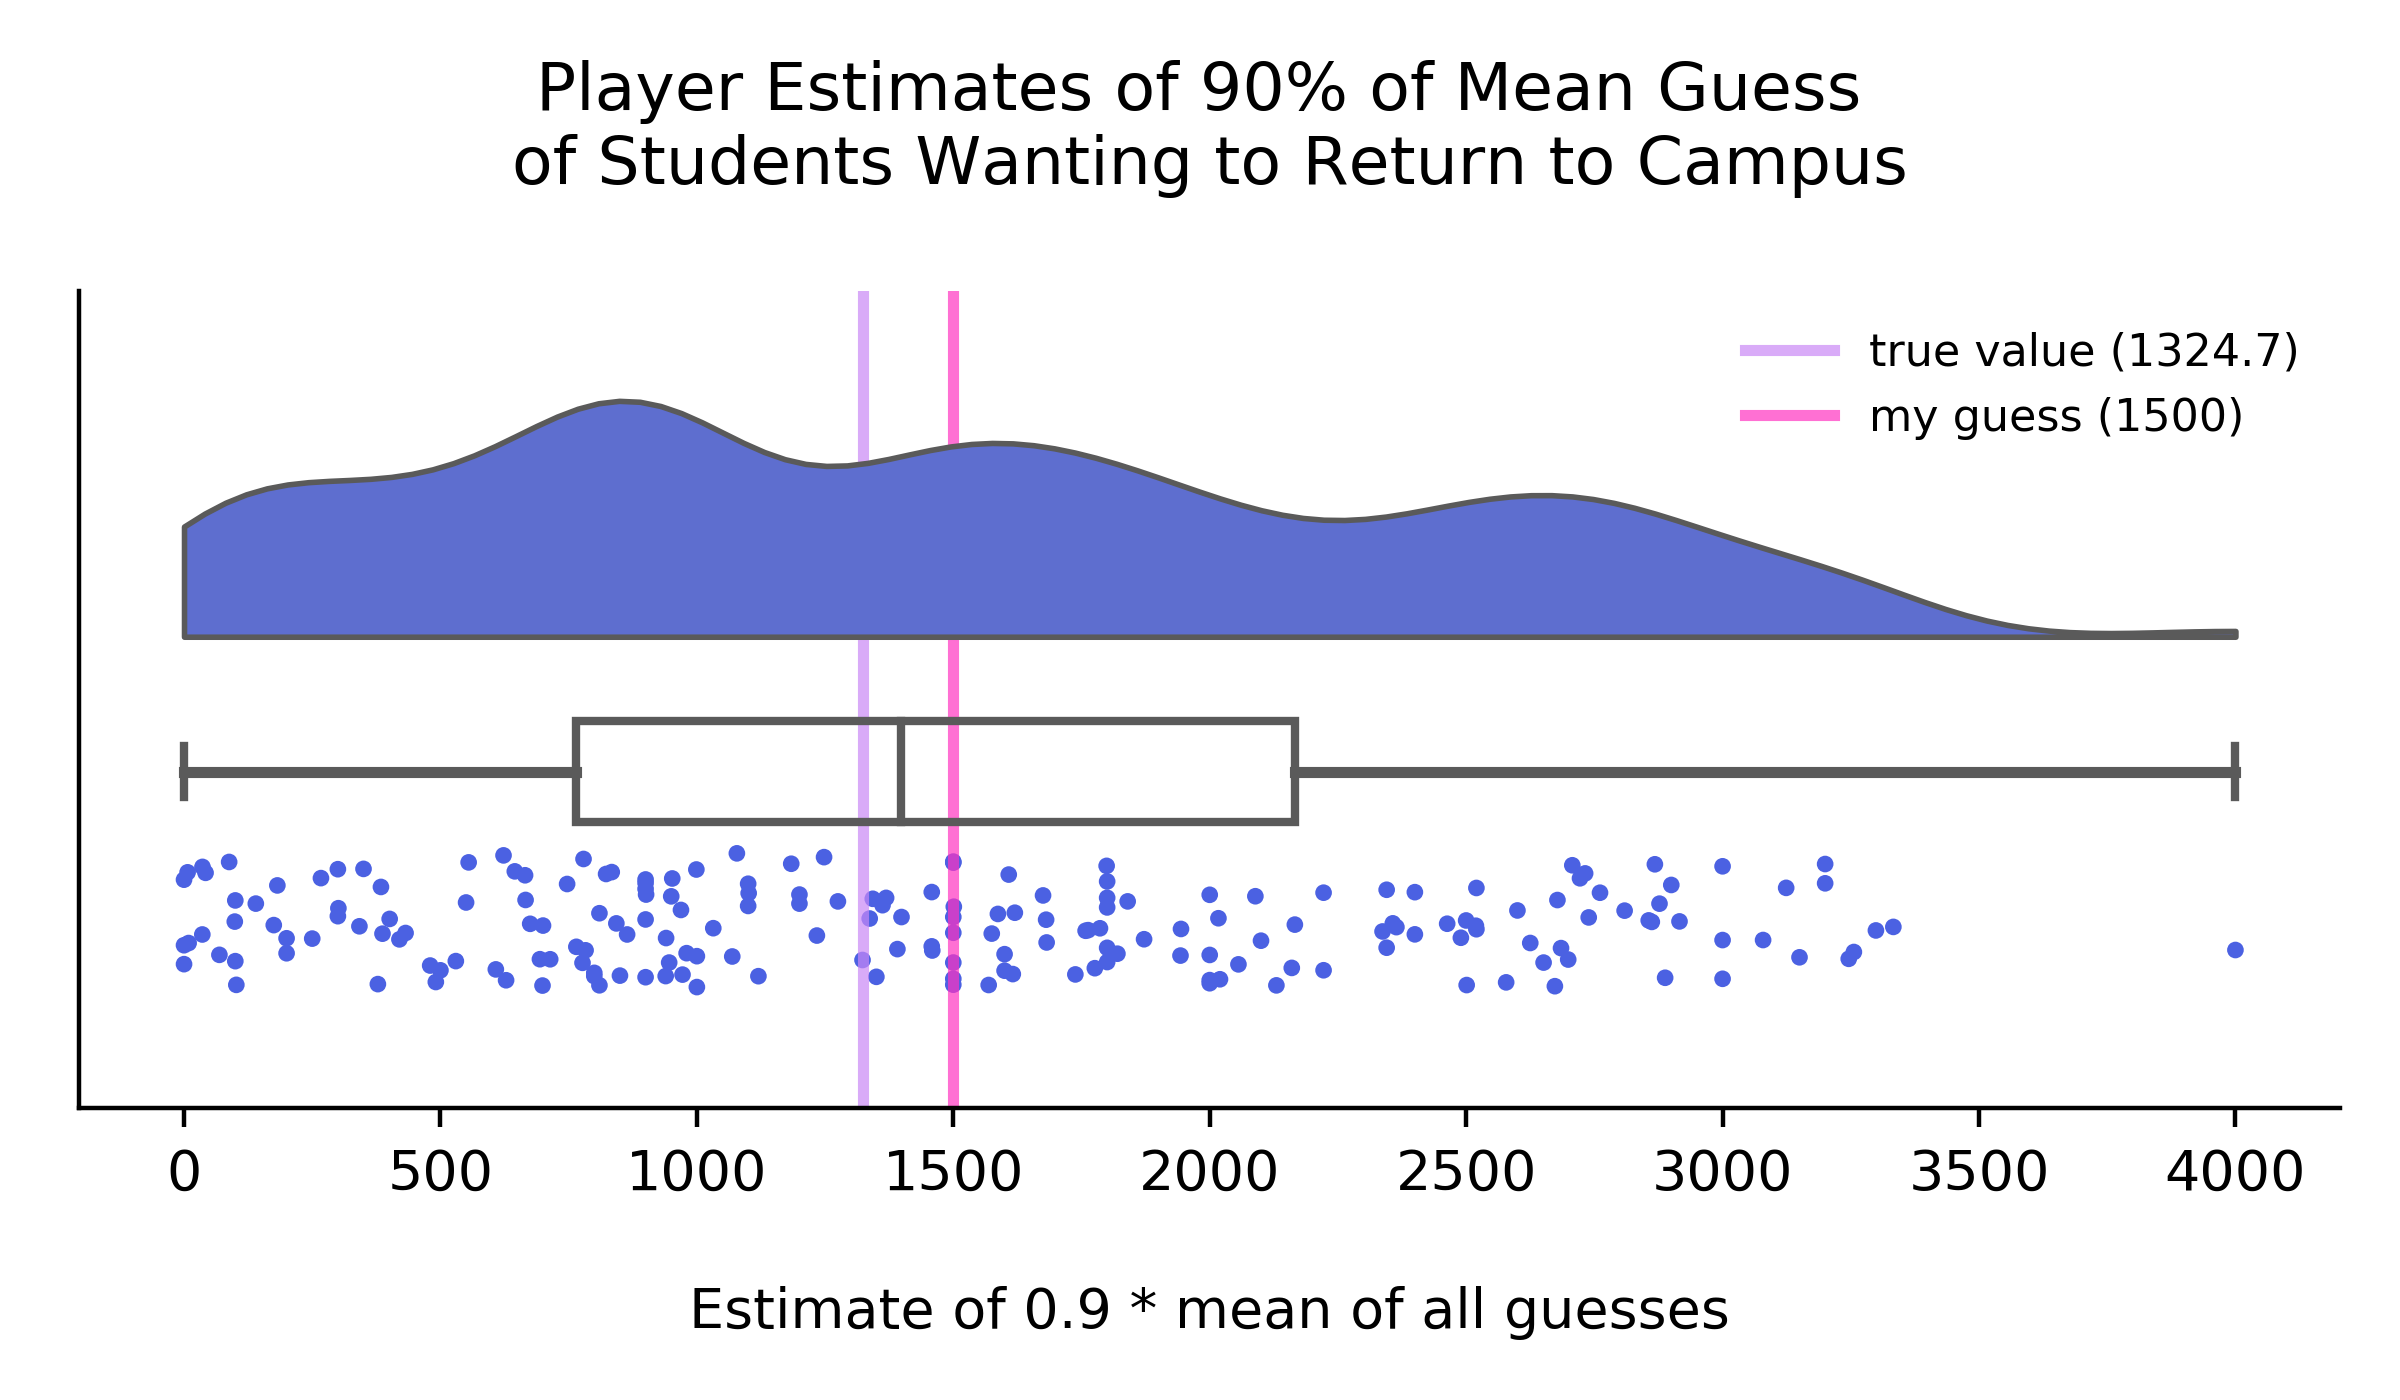
I guessed 1500 students would be 90% of the mean guess and that there would be a standard deviation of 400. I placed 20th out of 201 players. I remember making my guess using literal data. MIT had just released a plan from MIT which would bring back one class of students along with any students who needed housing due to having a home environment unconducive to learning, which to my estimates would come out to about 1500. This wasn’t really what the game asked us to estimate – it wasn’t a guess of how many students would want to return – but I thought most people would probably rely on data.
MIT’s calculation of 90% of the mean guess was 1324.7. The winner was super close, with a guess of 1323!
There were a lot of ties from people estimating the same number, so the tiebreaker was very important.
I felt like this game was challenging to strategize about. It was hard to think about how the players might estimate the desire of students to go back; it seemed like a value that people probably all had different perceptions of depending on their immediate and social media circles. It was also a bit odd to think about wanting to approximate 90% of the mean rather than the mean itself.
Game 5: Institvte Fundraising
Rules
- You are an MIT student who has just graduated. MIT calls you up and asks for donations to an undergraduate fund. You have 1000 coins that you can donate.
- After the money in the fund has been increased fifty-fold, the fund is split evenly among all students (the number of students in this case is the number of people who play Game 5).
- To incentivize higher donations, students whose donations fall into the lowest quartile (lowest 25%) will be penalized by some amount. The exact penalty is determined by the players; each player will submit a value from 50 to 300 with which they would like to penalize the lowest quartile of donors. The actual penalty given would be the average of all penalties submitted.
- Your objective is to end up with as many coins as possible. Your total coins are calculated from:
- Adding the remaining coins you have that you didn’t donate to the fund.
- Adding the coins you receive back from the fund, calculated as (50 * number of total coins invested in the fund)/(total number of players). This value is the same for every player.
- Subtracting the penalty, if you’re in the lowest quartile.
- As a tiebreaker, each player guesses the mean of all penalties submitted.
Analysis and Visualization
I donated 6 coins of my 1000. I submitted a desired penalty of 50 coins. For the tiebreaker, I guessed that there would be a 200 coin penalty. I placed 31st out of 176 players.
Results: The 25th percentile of all donations was 120.25 coins. The assigned penalty was averaged to 203.64 coins.
I went with what I felt was a “safe” strategy. After Game 4, I had made it into the top scorers, so in Game 5, I just wanted to maintain my position. I didn’t need to do great achieve this (see later in the post for how final rankings were calculated), just avoid doing badly. I realized that if I donated nothing, the “worst” I could do was 700 coins, assuming worst-case conditions of ending up in the bottom quartile and having the maximum penalty of 300 coins subtracted. Under those conditions, anyone who donated over 300 coins would be on equal if not worse footing than me. I assumed that many players would make donations of over 300 coins, making this a safe strategy to avoid being at the bottom.
I chose to donate 6 coins, rather than 0, because I was hoping that enough players would donate 0 or 1 coins and I would be pushed out of the 25th percentile, thus avoiding the penalty. However, not enough players actually ended up taking that approach. I ended up in the lowest quartile and took the penalty.
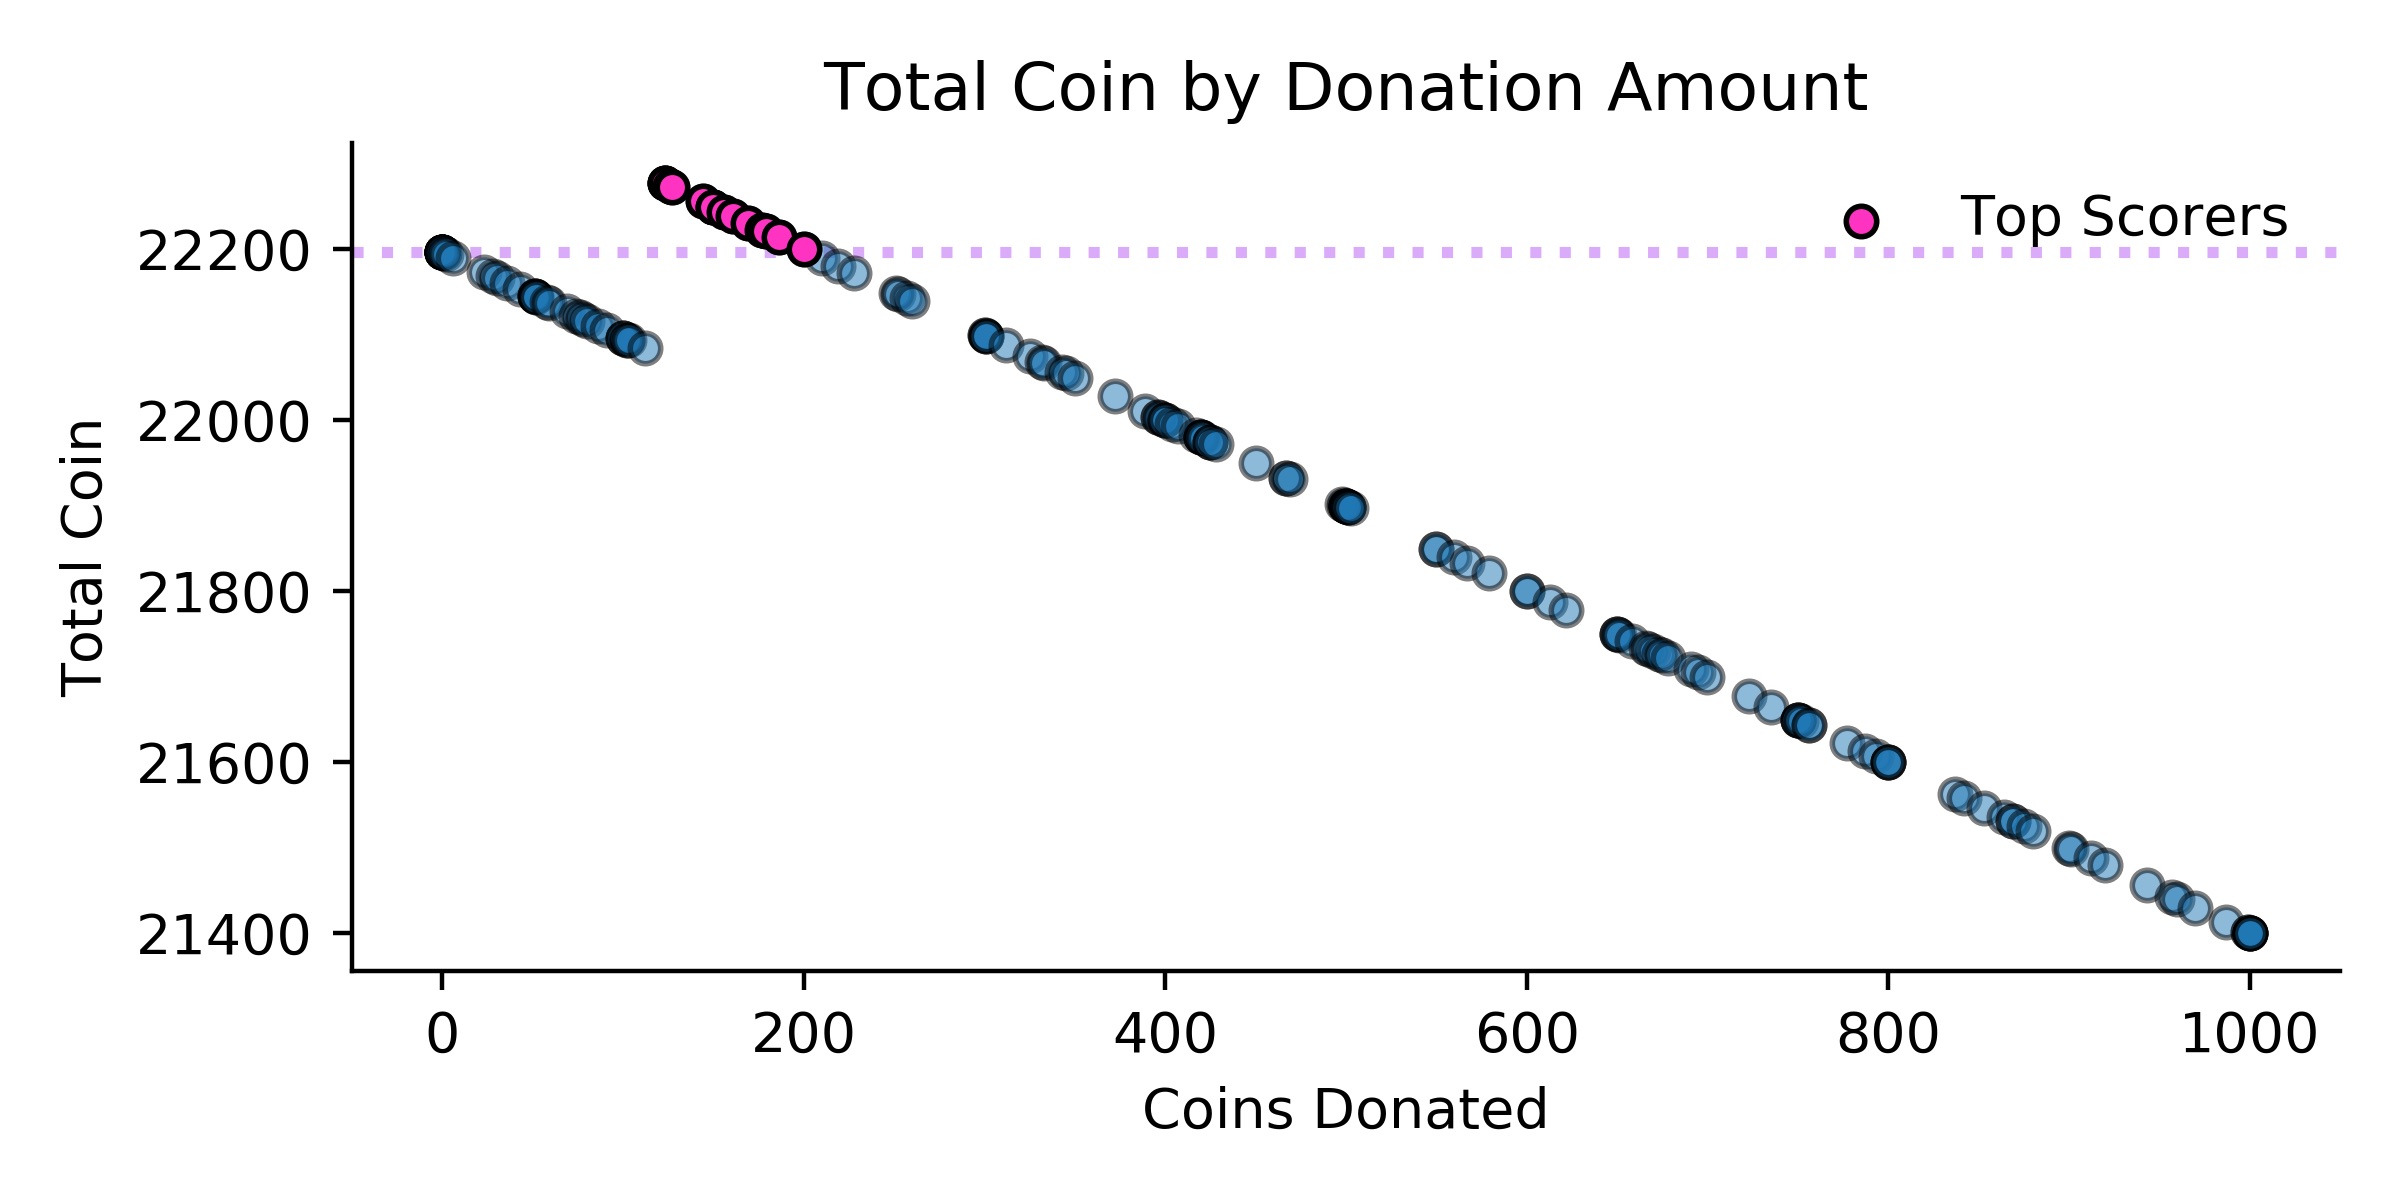
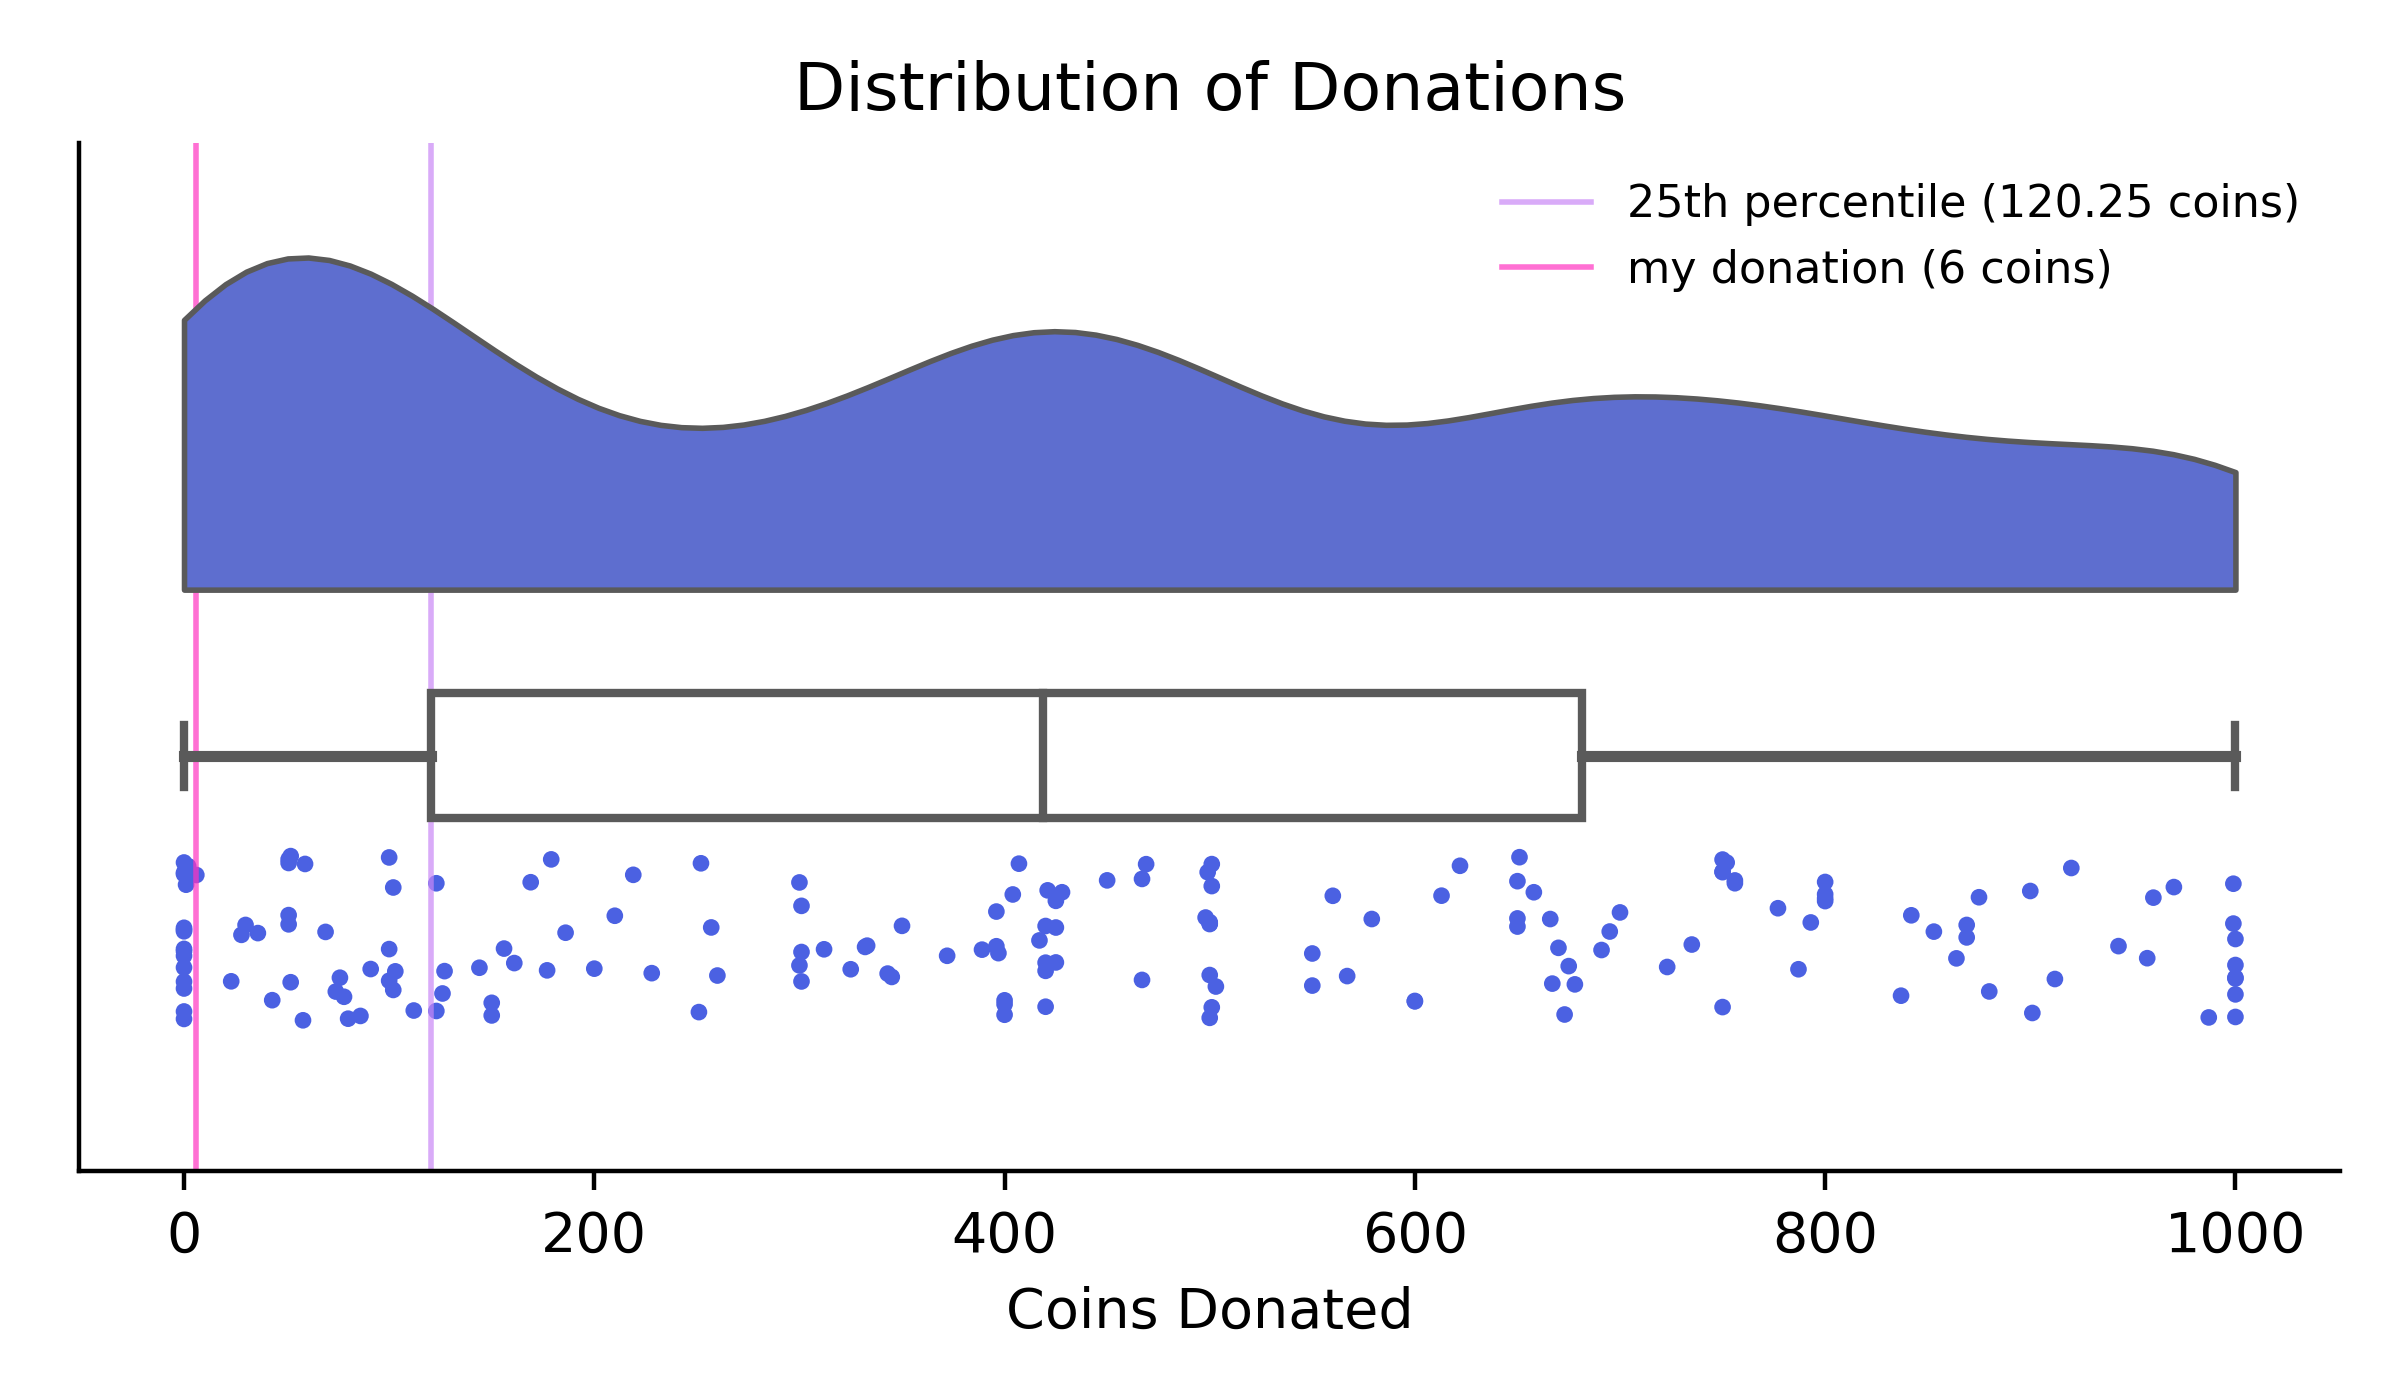 The penalty meant that players who donated an amount x less than 120.25 coins had identical scores as someone who donated x + 203.64 coins. Thus, the players with the most total coins were those who donated more than 120.25 coins (thus avoiding the penalty) but less than 203 coins (at which point those who donated 0 coins have the same score).
There were two types of players I couldn’t understand at all: those who donated all 1,000 coins, and those who donated 0 coins but requested the maximum penalty.
Final Rankings
The final rankings were calculated using a geometric mean (the five places each player received were multiplied together and a quintic root was taken). The geometric mean of my places (162, 95, 5, 20, 31) was 34.33. It was cool to win a prize, especially after starting out with a mediocre few places. I remember being a bit busy the day Game 2 was due and considering not submitting – this is just another reminder to me of the great value of persisting through ups and downs.
I’m looking forward to the live gameshow where the winners of the five individual games will compete for an additional $399 in prizes! Competing in dormspam-the-game was an unexpected way to stay connected with the MIT community this summer and I’m incredibly grateful to the (still anonymous) Gamemasters!
- To be completely accurate, I actually had the 4th-highest score, but since the person who placed just above me won 1st place for an individual game, he was removed from the overall rankings to progress to the live game show. Thus I ended up 3rd and won $15 along with the other top ten scorers. back to text ↑
- which stands for Missouri Institute of Taxidermy, in dormspam-the-game back to text ↑